
Figure 2.
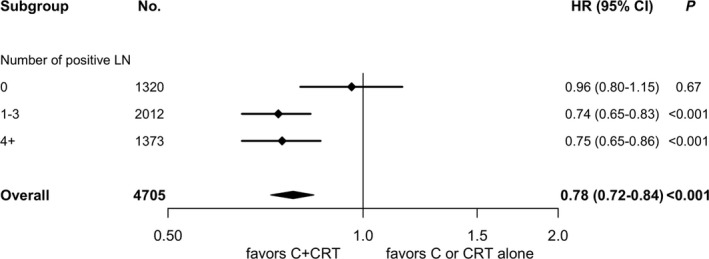
Forest plot for subgroup analysis. C, adjuvant chemotherapy; C + CRT, adjuvant chemotherapy followed by chemoradiation; CI, confidence interval; CRT, chemoradiation; HR, hazards ratio; LN, lymph node; No., number of patients
Official websites use .gov
A
.gov website belongs to an official
government organization in the United States.
Secure .gov websites use HTTPS
A lock (
) or https:// means you've safely
connected to the .gov website. Share sensitive
information only on official, secure websites.
Forest plot for subgroup analysis. C, adjuvant chemotherapy; C + CRT, adjuvant chemotherapy followed by chemoradiation; CI, confidence interval; CRT, chemoradiation; HR, hazards ratio; LN, lymph node; No., number of patients