
Figure 5.
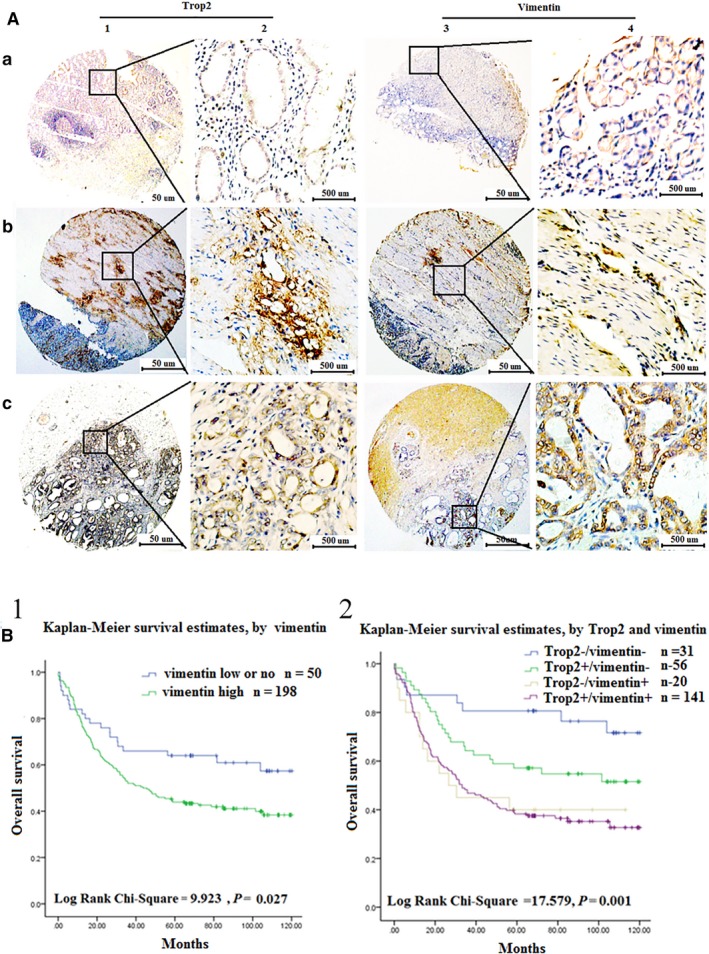
The expression level of Trop2 and vimentin was positively correlated in GC patients. A, The expression of Trop2 and vimentin was detected in 248 cases of GC patient tissues by IHC. a1‐2, low or no expression of Trop2 in GCN samples (IHC score, 30). b1‐2, high expression of Trop2 in NMGC samples (IHC score, 180).c1‐2, high expression of Trop2 in MGC samples (IHC score, 230). a3‐4, low or no expression of vimentin in GCN samples (IHC score, 100). b3‐4, high expression of vimentin in NMGC samples (IHC score, 150).c3‐4, high expression of vimentin in MGC samples (IHC score, 250). B, Survival curves for gastric cancer using the Kaplan‐Meier method and the log‐rank test. B1, Overall survival curves for patients with low or no expression of vimentin (blue line, 1), high expression of vimentin (green line, 2). B2, Overall survival curves for patients with Trop2−/vimentin−expression (blue line, 1), Trop2+/vimentin− (green line, 2), Trop2−/vimentin+ (gray line, 3), and Trop2+/AREG+ (purple line, 4)