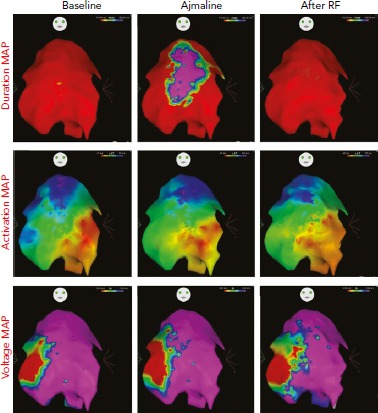
Figure 2: 3D Potential Duration Mapping, Activation Mapping and Voltage Mapping in Brugada Syndrome with Concealed ECG Pattern.

The potential duration map shows after ajmaline an abnormal area with prolonged fragmented epicardial potentials normalised after ablation (post-RF). Voltage and activation mapping are basically normal and similar before and after ablation.
