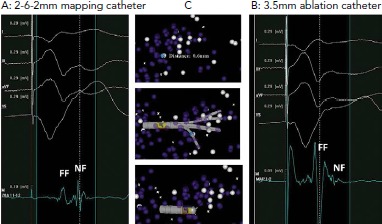
Figure 3: The Impact of Electrode Characteristics on Electrogram Recordings.

A: Electrograms recorded with a dedicated mapping catheter. Clearly separated near-field and far-field components are visible. B: Electrograms recorded at the same site (0.6 mm separation) with a 3.5 mm ablation catheter. The near-field component is almost completely obscured by the much larger far-field component. C: A 3D mapping system demonstrating the relative positions of the electrograms recorded. Electrode orientation is similar with each catheter. FF = far-field; NF = near-field. Source: Berte et al.[10] Reproduced with permission from John Wiley and Sons.
