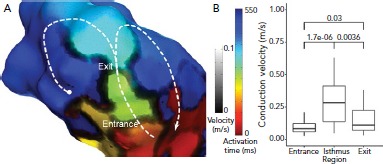
Figure 4: Wavefront Velocity in the Ventricular Tachycardia Circuit.

A: timing data has been extracted from the Rhythmia mapping system and reanalysed using custom scripts in MATLAB software (MathWorks). Activation time is represented by colour and identifies a single loop re-entrant ventricular tachycardia (VT) in the border of a large anteroseptal scar region. Activation proceeds through the VT isthmus before breaking out into the outer loop (white dashed line). To the right of the image, activation proceeds in a re-entrant loop (white arrow) but to the left, activation is stopped by a line of block (white circle). Conduction velocity is indicated by the grayscale overlay and clearly shows zones of very slow conduction or block defining the lateral margins of the isthmus. There is another line of block outside the isthmus which results in a single loop, rather than dual loop, VT circuit. There are regions of slow conduction in the entrance and exit of the isthmus. Other regions of slow conduction are present elsewhere in the ventricle, but do not play a direct role in the VT circuit. B: median conduction velocity in entrance, isthmus and exit zones, and median (apparent) conduction velocity in zones of complete block and functional block which define the isthmus. P-values for comparisons are shown. Source: Martin et al.18 Reproduced with permission from Wolters Kluwer Health.
