
Figure 7: Comparison of Activation and Pace Mapping of the Ventricular Tachycardia Exit.
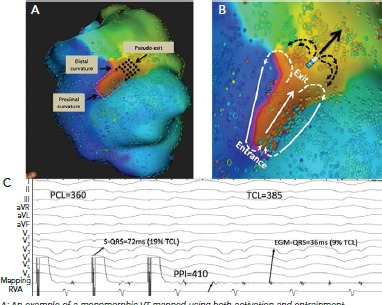
A: An example of a monomorphic VT mapped using both activation and entrainment techniques. The length of the isthmus determined by activation mapping was measured from the proximal curvature (entrance) to the distal curvature (exit) and is highlighted in a red dashed ellipse. Dimensions of the isthmus were also measured using standard entrainment criteria and included sites with concealed QRS on all 12 electrogram (EGM) leads and PPI-TCL ≤30 ms (gray dashed rectangle). Although the two methods similarly identified the proximal curvature (entrance) and the width of the common channel, entrainment mapping overestimated the length of the isthmus, particularly at the exit site. The pseudo-exit is the zone considered part of the circuit using entrainment mapping but not part of the circuit by activation mapping (black dots). C: An example of entrainment from a pseudo-exit site (electrode, shown in B). The bipolar EGM at the pacing site occurs just before the QRS complex (EGM to QRS of 36 ms; 9% of the TCL). Entrainment from this site resulted in concealed QRS fusion, as the stimulated pacing site assumes a similar wave front vector to the VT (solid arrow). However, in contrast to a true exit site, pacing from a pseudo-exit site resulted in a longer PPI with PPI-TCL of 25 ms. This is because the pacing site is beyond the distal curvature (white arrows) and propagation of its wave front in the figure-eight configuration (black arrows) assume a curvature shape that encounters a partially refractory tissue, both result in slower conduction and prolonged postpacing interval. PCL = paced cycle length; PPI: postpacing interval; RVA = right ventricular apex; TCL: tachycardia cycle length. Source: Anter et al. 2016.[17] Reproduced with permission from Wolters Kluwer Health.