
Fig 2.
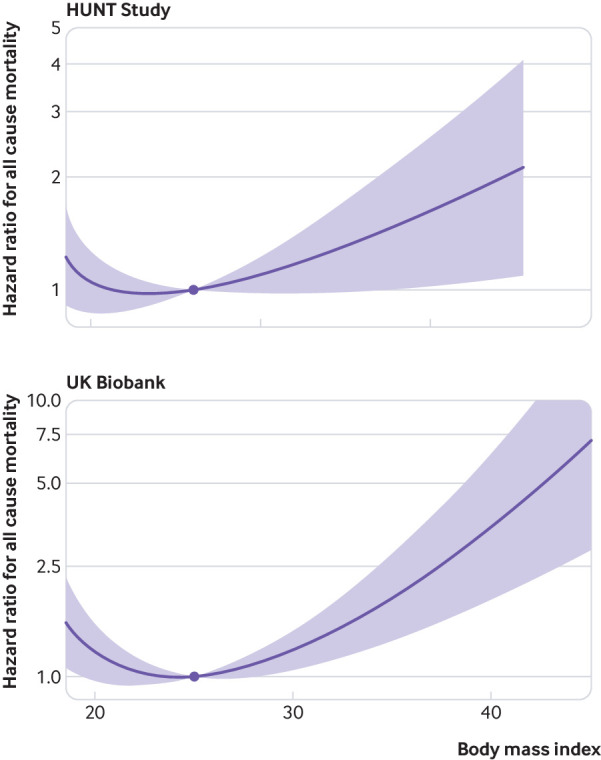
Non-linear mendelian randomisation. Dose-response curve between body mass index and all cause mortality for HUNT Study and UK Biobank. Gradient at each point of the curve is the localised average causal effect. Shaded areas represent 95% confidence intervals