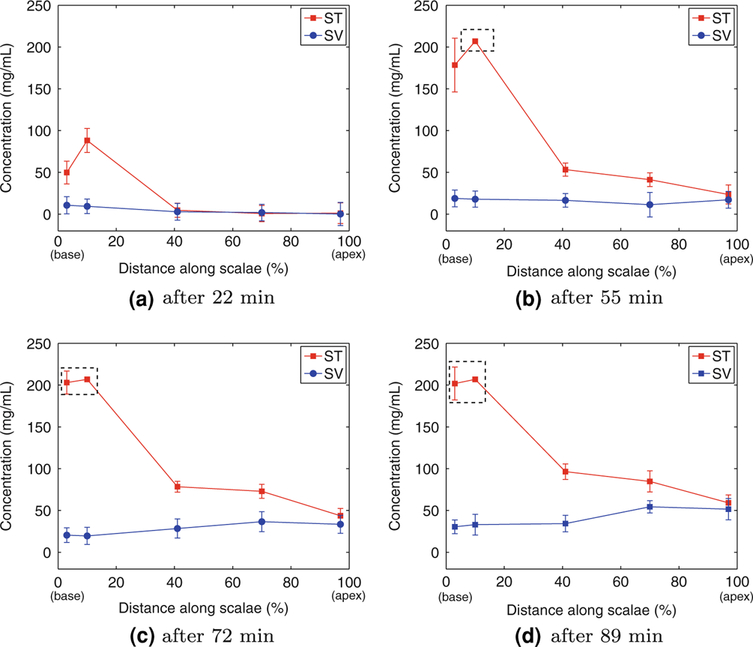
FIGURE 10.

Comparison of ioversol concentration levels along ST and SV in one animal after (a) 22 min, (b) 55 min, (c) 72 min, and (d) 89 min of the continuous infusion of ioversol. The concentration levels were calculated from average pixel intensities of selected ROIs inside the three μCT image slices of Fig. 6. Error bars represent the standard deviation of concentration levels inside the selected ROIs. Note that distance is expressed as the fraction of length of ST (from RW). The dashed rectangles in (b), (c), and (d) highlight points that have reached the saturation limit.
