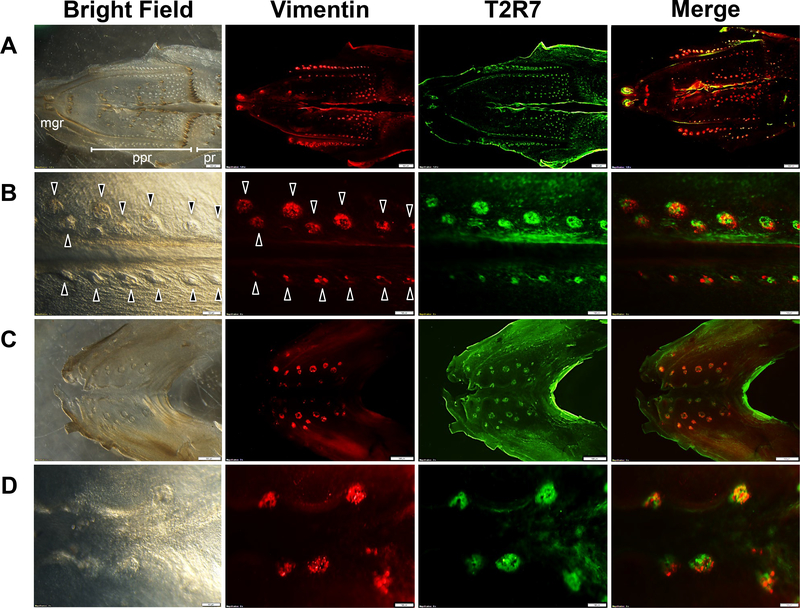
Fig. 1.
An oral epithelial sheet of the palate shown at low magnification to illustrate the 3 different regions, i.e., the maxillary gland region (mgr), palatine papilla region (ppr), and posterior region (pr) (A), and at high magnification (B). An oral epithelial sheet from the base of the oral cavity is also shown at low (C) and (D) high magnification. The bright-field image, distribution of Vimentin (red) and T2R7 (green) immunosignals, and merged images of oral epithelial sheets of chickens are shown. Merged images show the overlay of Vimentin (red) and T2R7 (green). Arrowheads shown in B indicate representative taste bud clusters characterized by the Vimentin signals or by the morphology from the bright-field image. Scale bars: 500 μm in (A,C) and 100 μm in (B,D).

