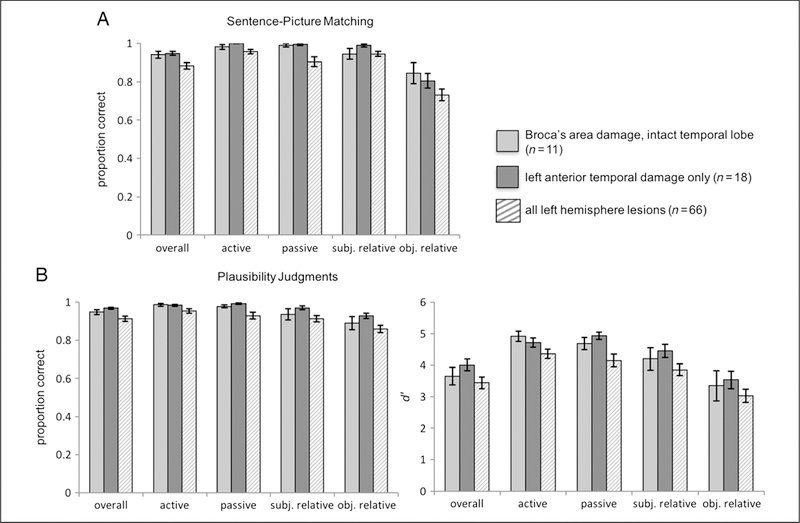
Figure 3.

Graphs of mean group performance on the (A) sentence–picture matching task and on the (B) plausibility judgments. The light and dark gray solid bars represent the Broca’s and ATL groups, respectively. The striped bars represent performance of all left-hemisphere participants, for example, all participants included in the VLSM analyses. For the plausibility judgments, both proportion correct and d′ group mean performance are shown. Error bars represent SEM.
