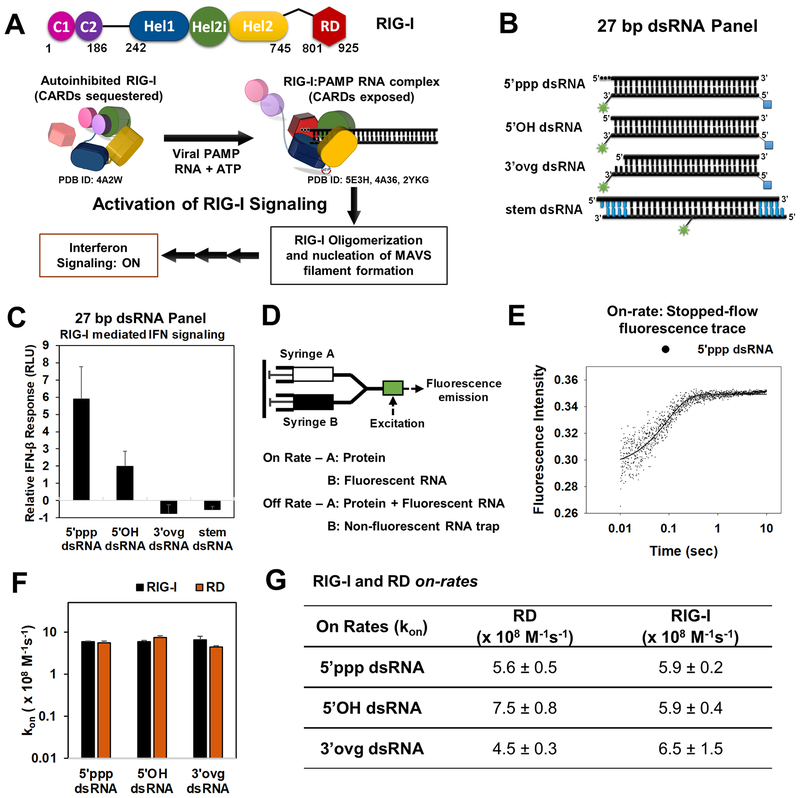
Figure 1. RIG-I activation pathway and RIG-I/RD on-rates on 5’ppp and non-PAMP dsRNAs.
(A) Schematic of a general activation mechanism of RIG-I. (B) Cartoon of the dsRNAs used in the study (green asterisk-DY547/Cy3; blue square-biotin; blue bars-DNA bases). (C) IFN-β reporter activation in HEK293T cells expressing RIG-I and transfected with the dsRNA panel from B. Error bars are SEM from quadruplicate sets. (D) Stopped-flow experimental set up for on-rate and off-rate measurements. (E) Representative stopped-flow time course shows an increase in fluorescence intensity upon binding of RIG-I (45 nM) to 5’ppp dsRNA (10 nM) at 25°C. (F, G) On-rates of RIG-I and RD. The associated errors from the linear fits are shown. See also Figure S1.

