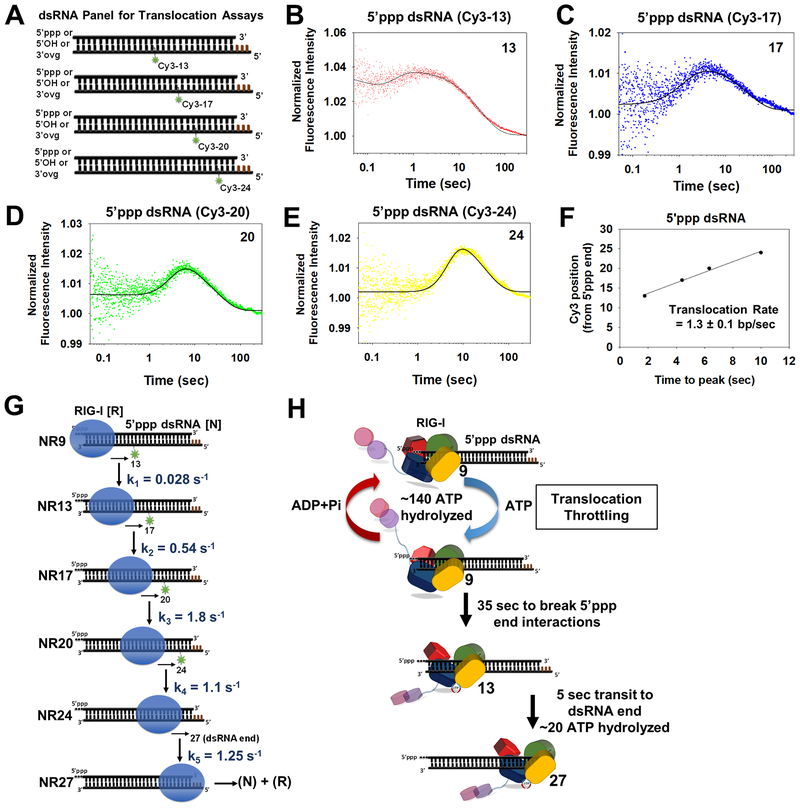
Figure 5. Stepping rates of RIG-I translocation.
(A) Schematic of a panel of Cy3 labeled 27bp dsRNAs for RIG-I translocation studies (Brown bars-DNA bases). (B-E) Transient state kinetics of RIG-I translocation on the 5’ppp dsRNA measured by Cy3 fluorescence intensity changes. The position of Cy3 from the RNA-end is denoted. Solid lines are fit to the model in G. (F) Time-to-peak increases linearly with Cy3 position and slope provides the average translocation rate. (G) The minimal translocation model fits the stopped-flow translocation data in B-E (solid lines) with the given stepping rates. (H) Translocation throttling mechanism of RIG-I at the 5’ppp end. See also Figure S5 and Table S7.

