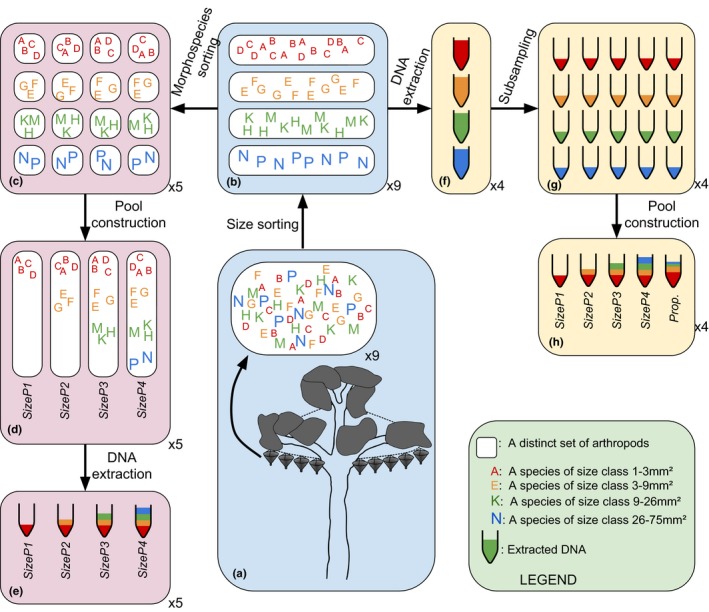
Figure 1.

Diagram showing construction of size pools, both the Specimen method (a–e, blue and pink backgrounds) and the DNA method (a–b,f–h, blue and yellow backgrounds). Colored letters denote individual arthropods, each different letter a different morphospecies. Letter color and size denote size class, white boxes distinct samples, as shown in the legend. Tube cartoons denote distinct DNA samples, with colors denoting size class(es) of contents. For Specimen method size pool construction (blue, pink), arthropods from raw mixed tray samples (a) were sorted into size classes (b). Each size class was then sorted into subsamples of identical morphospecies and abundance composition (c). Four Size Pools (SizeP) were constructed from sets of these subsamples, such that each Size Pool contained a representative subsample of the size classes included (d). DNA was then extracted from each of these Size Pools (e). This process was carried out for five tray samples, resulting in 20 Size Pool samples for sequencing. For DNA size pool construction (blue, yellow), arthropods were also sorted to size class (a, b, as above). DNA was extracted from each size class (f), and each DNA extract was split into five equal parts (g). Size pools were constructed from sets of these equal parts as shown. For SP1–SP4, equal quantities of each size class were combined (h). For the Prop. composite pool, DNA was combined proportional to the inverse of the mean size of each size class, at a ratio of 64:16:4:1 from smallest to largest class. This process was carried out for 4 tray samples, resulting in 20 Size Pool samples for sequencing
