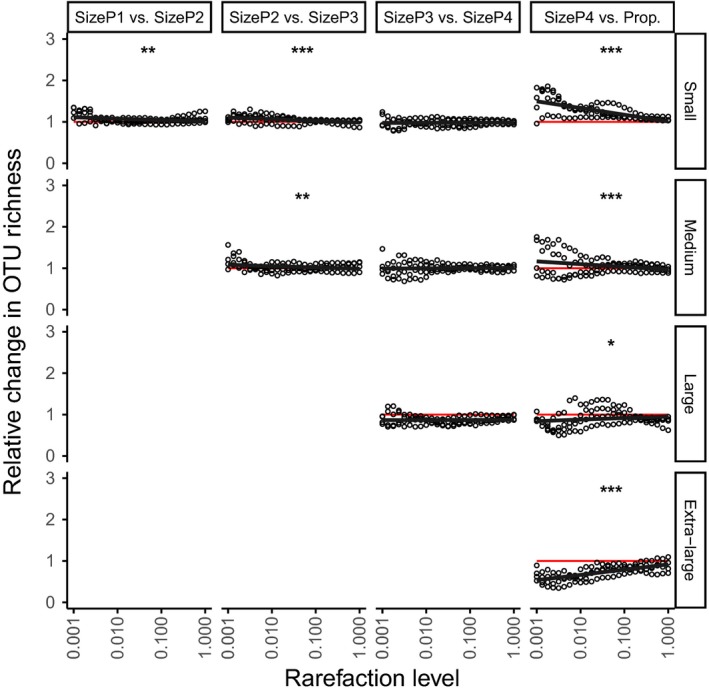
Figure 3.

Relative change in number of OTUs recovered between pairs of composite pools (columns) within size classes (rows), over simulated variation in read depth, using only the data from the laboratory‐constructed samples. Read depth is represented by differing levels of rarefaction, representing increasingly lower read numbers. The x‐axis increases from 0.1% to 100% of the values used in rarefaction of this dataset for the main analyses (Supporting information Table S1). Columns of panels show pairwise comparisons between successive pairs of pools, for example, the rightmost panel compares the number of OTUs recovered in SizeP4 and Prop, split into the four different subcommunities based on size (rows). Comparisons are the proportional change in the number of OTUs: Where T C is the number of OTUs in a less complex size class, and T C+1 is the number of OTUs in the next more complex, proportional change is calculated as . Values above the red line show an increase in the number of OTUs recovered going from the less complex to the more complex experimental communities. Fitted lines are lmer fits controlling for variation between sample, and stars show significance of slope compared with 0 (*0.01 < p < 0.05, **0.001 < p < 0.01, ***p < 0.001)
