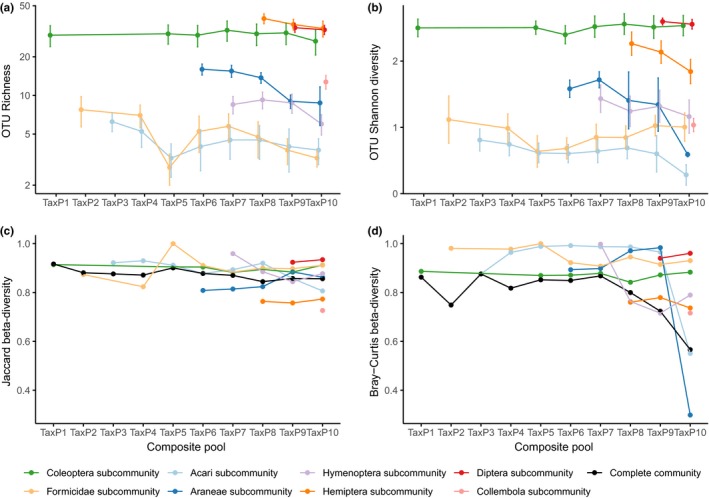
Figure 4.

The recovery of OTUs and community turnover patterns for different taxa (colors), for each of 10 pool types (x‐axes). Subplot (a) shows number of OTUs recovered, and subplot (b) shows Shannon diversity of OTUs taking into account read numbers. For (a and b), points and error bars show mean and standard error. Note that where taxon point is absent for a pool type (e.g., there is no green Coleoptera point for TaxP2), this taxon was not included in this construction. Bottom plots report multisample beta‐diversity ((c) Jaccard, using presence–absence only, (d) Bray–Curtis, using read numbers) between replicates for each pool type, for each separate taxon subcommunity and for all subcommunities in the pool together. For example, four source samples were used to construct experimental pools. For the library where the Coleoptera, Acari, and Formicidae were combined (TaxP5), we calculate beta‐diversity between the four Coleoptera subcommunities from those replicates (green point), for the Acari and Formicidae fractions as well (light orange and light blue points), and for the complete community comprising all three subcommunities (black point)
