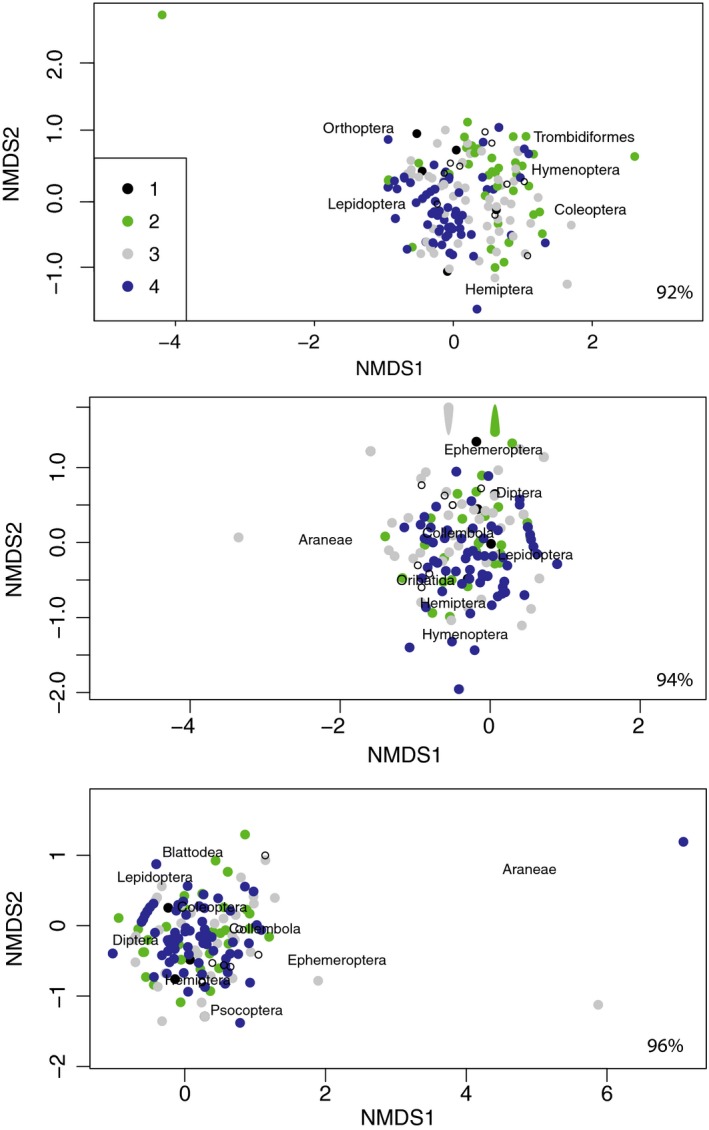
Figure 4.

Non‐metric multidimensional scaling (NMDS) of foraging data for bats in Big Bend National Park Texas based on behavioral categories described by Ratcliffe et al. (2006): (1) gleaning bats, (2) behaviorally flexible bats (gleaning and aerial hawking, (3) clutter‐tolerant aerial hawking bats, and (4) open space aerial hawking bats. White dots with black circles indicate prey types with the most common labeled. A SIMPER analysis suggests that the largest difference in prey usage is found between group 2 and 3 bats. Similar outcomes are seen at 3 MOTU thresholds (92%, 94% and 96%)
