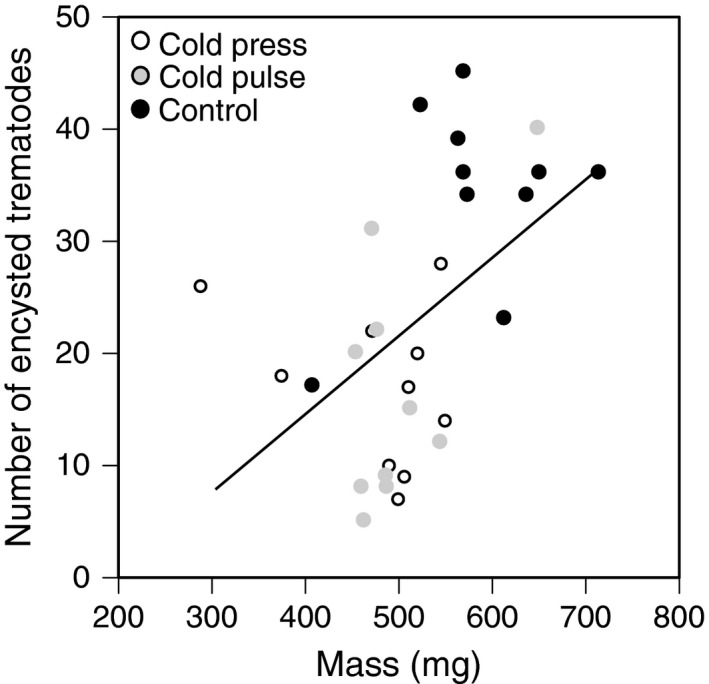
Figure 5.

The relationship between tadpole mass and susceptibility to parasites 24‐days post‐hatch. Open circles represent tadpoles from the cold‐press treatment, gray circles represent tadpoles from the cold‐pulse treatment, and black circles represent tadpoles from the control treatment
