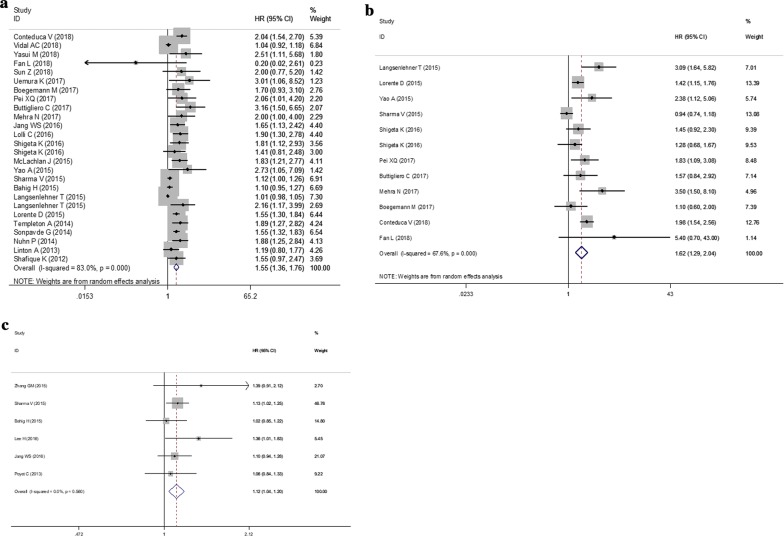
Fig. 2.
Forest plots of the significant correlations of neutrophil to lymphocyte ratio with survival. a Overall survival; b progression-free survival; c recurrence-free survival. Squares are hazard ratio (HR); horizontal lines are 95% confidence intervals (CI); blue diamond indicates the pooled HR estimate with its 95% CI

