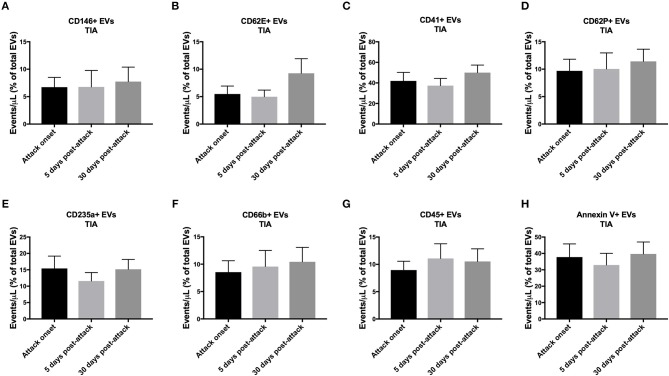
Figure 6.
Circulating EV levels, expressed as events/μL (% of total EVs), at onset, 5-days and 30-days post-attacks in PFP from patients with TIA. Histograms represent circulating levels of EVs derived from: (A) endothelial cells (CD146+), (B) activated endothelial cells (CD62E+), (C) platelets (CD41), (D) activated platelets (CD62P+), (E) erythrocytes (CD235a+), (F) granulocytes (CD66b+), (G) leukocytes (CD45+), (H) and pro-coagulant (Annexin V+) origins. Data are expressed as mean ± SEM. TIA, n = 21.

