Figure 7.

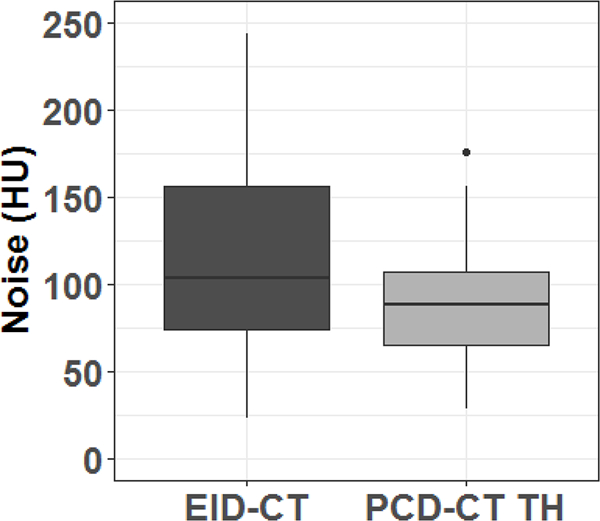
Comparison of noise (standard deviation of CT numbers in a uniform region of interest in fat) between photon-counting-detector (PCD)-CT high-energy threshold images (TH) and energy-integrating-detector (EID)-CT images.

Comparison of noise (standard deviation of CT numbers in a uniform region of interest in fat) between photon-counting-detector (PCD)-CT high-energy threshold images (TH) and energy-integrating-detector (EID)-CT images.