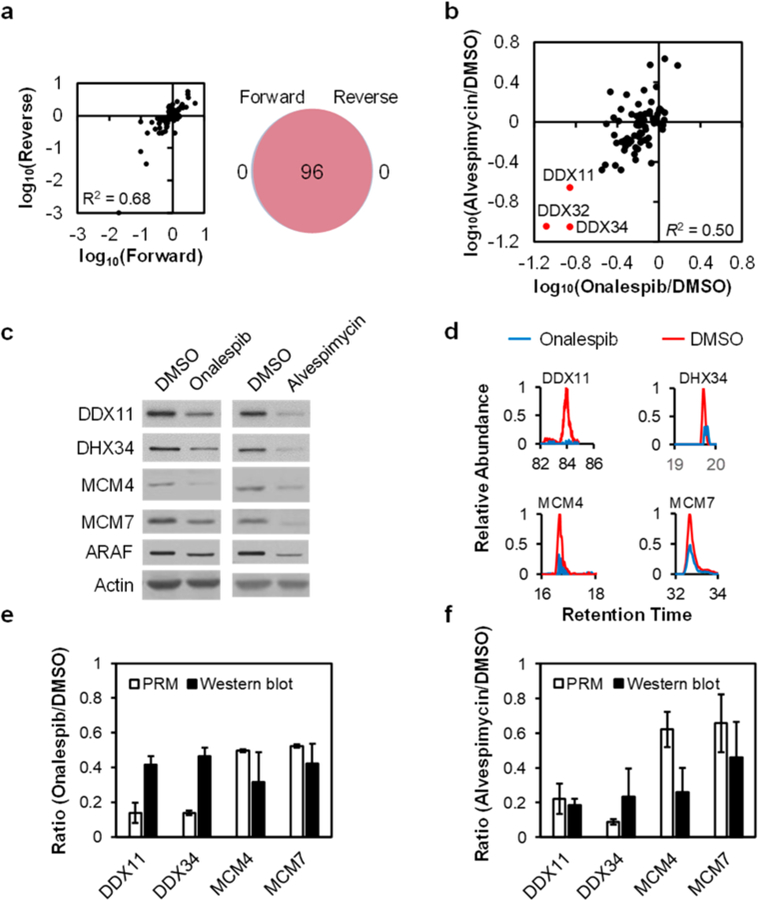
Figure 3.

Analytical performance of the PRM method. (a) A scatter plot displaying the correlation between the ratios obtained from forward and reverse SILAC labeling experiments (left), and a Venn diagram showing the overlap between quantified helicases from the forward and reverse SILAC labeling experiments in M14 cells with or without alvespimycin treatment (right). (b) A scatter plot showing the correlation between the alterations in expression levels of helicase proteins in M14 cells treated with onalespib or alvespimycin. (c) Western blot for the validation of the expression levels of representative helicases in M14 cells with vs without HSP90 inhibitor treatment, where ARAF was used as a positive control. (d) PRM traces for the relative quantifications of representative helicases. (e, f) Quantitative comparisons of the ratios obtained from PRM (n = 2, one forward and one reverse SILAC labelings) and Western blot analyses (n = 3) for representative helicases in M14 cells with vs without a 24 h treatment with 100 nM of onalespib (e) or alvespimycin (f).
