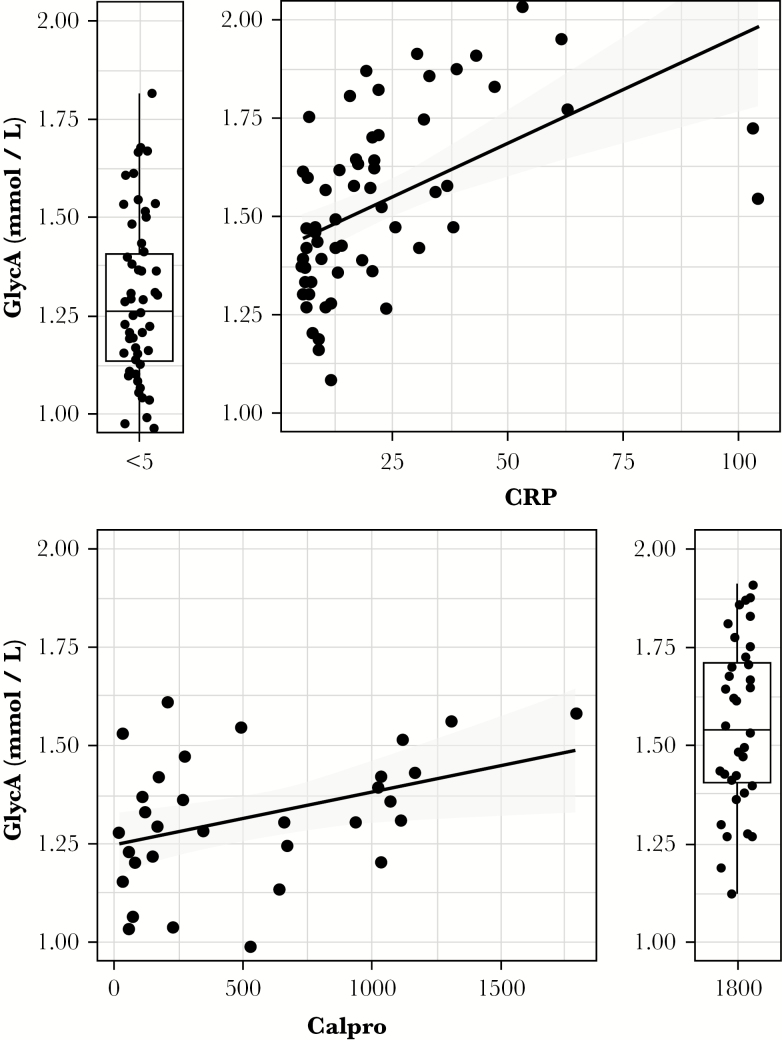
Figure 3.
Glycoprotein acetylation [GlycA], CRP, and fCal correlations. Correlation between GlycA and CRP [spearman ρ = 0.40, p = 0.02, top] and fCal [spearman ρ = 0.61, p < 10–8, bottom] is illustrated in all available data. Data at the lower detection limit for CRP [<5] or the upper detection limit for fCAL [>1800] are depicted as boxplots alongside the scatterplot. CRP, C-reactive protein; fCal, fecal calprotectin.

