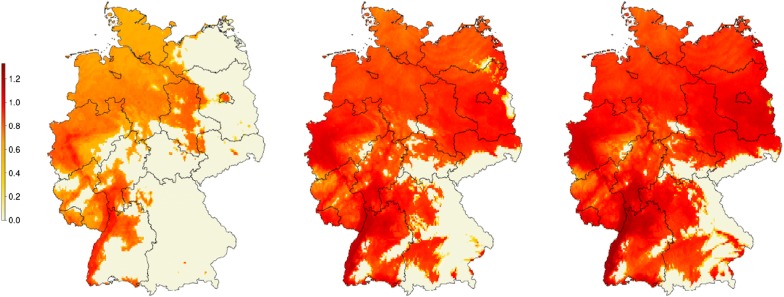
Fig. 3.
Modelled cumulative population density of Aedes j. japonicus larvae in Germany under climate change models. Scenarios current condition (left), CCSM4 RCP4.5 (middle), CCSM4 RCP8.5 (right), time period 2041–2060. Underlying raster layer is based on the CMIP 2.5’ models (approximately 4.5 km at equator), time period 2041–2060, from Worldclim database [51]. All larval densities are normalised by the highest observed larval density in the current condition scenario. Simulations ran for 5 years, densities were calculated in the fifth year

