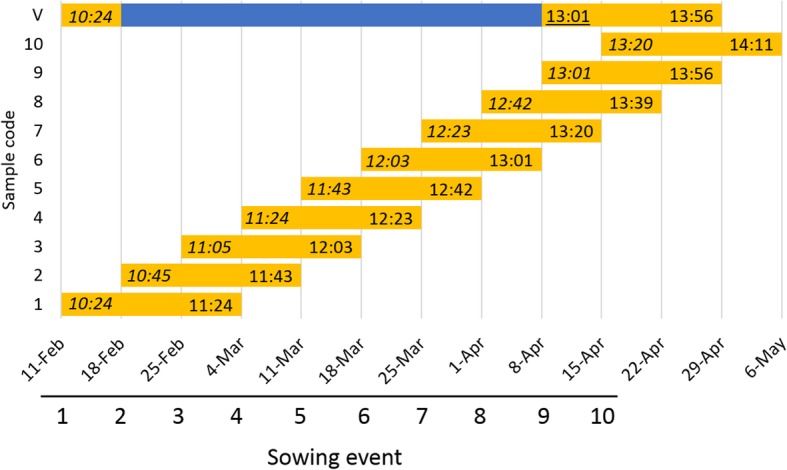
Fig. 1.

Experiment planning. Each sowing and its sampling are represented. Yellow bars show the time that plants were kept under non-vernalized conditions. Blue bar shows the time spent in the vernalization chamber. X-axis represent dates of start of experiment and sampling date (three weeks after sowing). The second numbers inside the yellow bars are the day-length at sampling date (HH:MM). The first numbers in italics represent day-length at sowing day, and underlined numbers are day-length in the shift day (vernalized plants were transferred to glasshouse). Sunrise and sunset are the times when the upper edge of the Sun’s disc touches the horizon
