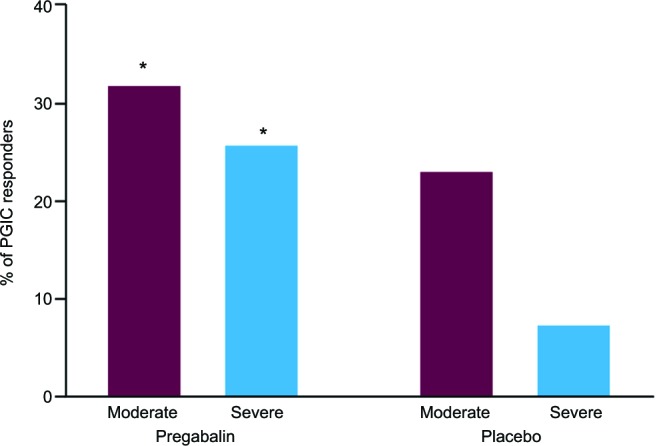
Figure 2.

PGIC responders at endpoint by baseline pain severity.
Notes: *P<0.05. PGIC responders were subjects who scored “much improved” (score=2) or “very much improved” (score=1) on a scale of 1–7. Baseline pain scores were defined as moderate (≥4–<7) or severe (≥7–10). Logistic regression model used with terms for treatment and baseline pain severity (moderate or severe) and interaction term of baseline severity and treatment as the categorical covariates.
Abbreviation: PGIC, patient global impression of change.
