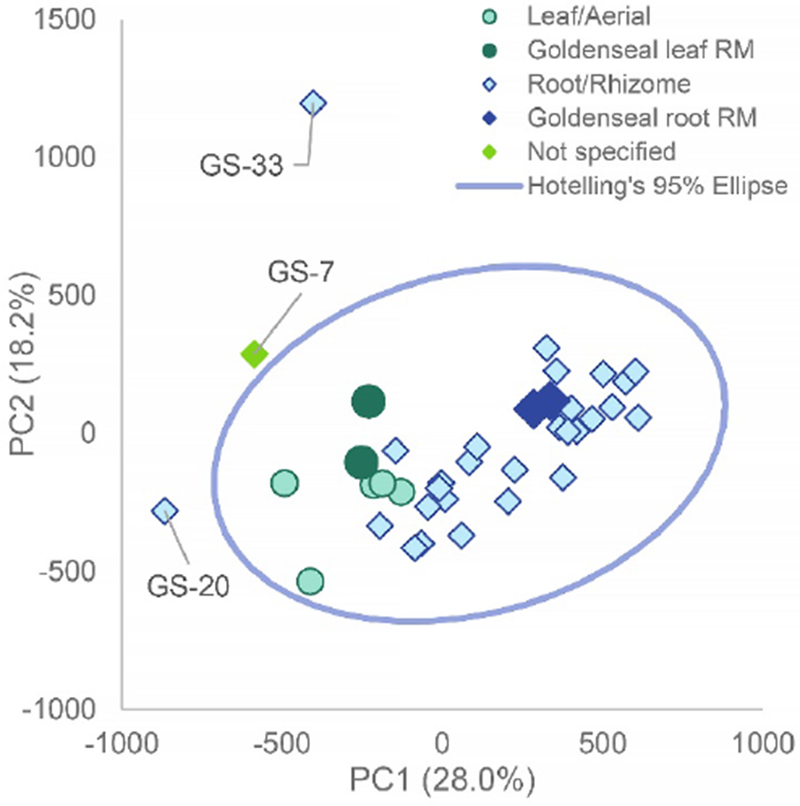
Fig. 1:

Principal component analysis (PCA) scores plot from untargeted mass spectrometry metabolomics analysis of commercial goldenseal samples. PC1 versus PC2 (25.0% and 17.3% explained variance, respectively) allowed for visualization of three distinct outliers: GS-20, GS-7, and GS-33. These outliers were distinct from the root and aerial samples (blue and green respectively) and fell outside the 95% Hotelling’s T2 confidence interval represented by the blue circle. The abbreviation “RM” represents “reference material” which are the standards that have been vouchered or purchased by Chromadex.
