
Fig. 4:
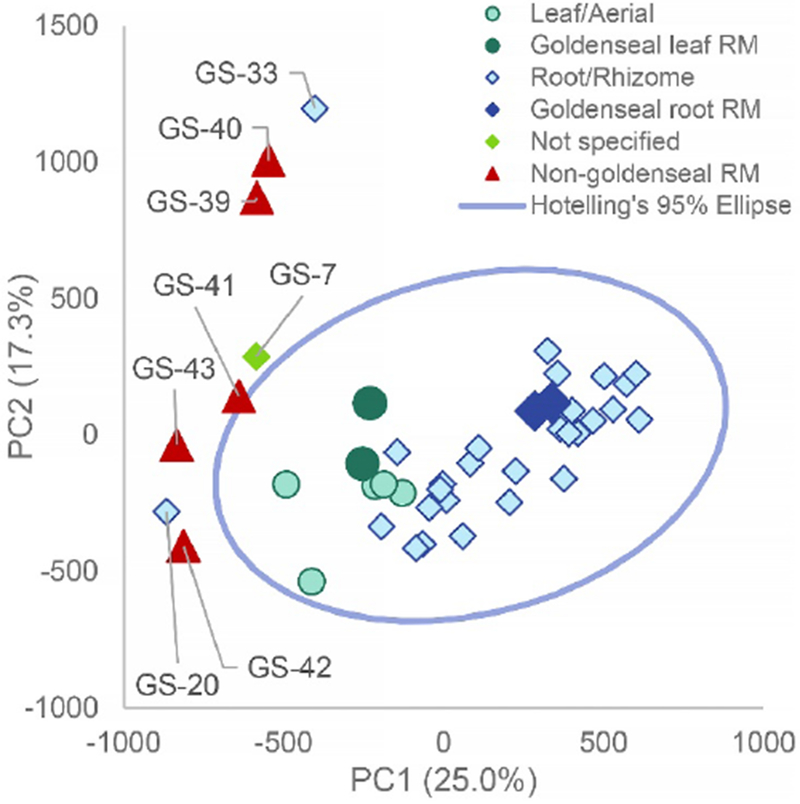
Principal component analysis (PCA) scores plot from untargeted mass spectrometry metabolomics analysis of commercial goldenseal samples with non-goldenseal reference material added for confirmation. Graphically comparing PC1 versus PC2 (25.0% and 17.3% explained variance, respectively) allowed for similar visualization as the original PCA analysis (Figure 1), showing clear discrimination between possibly adulterated supplements and goldenseal root/rhizome and aerial supplements. The blue line is a 95% confidence interval calculated using Hoetelling’s T2. The non-goldenseal reference materials (Coptis chinensis rhizome (GS-39), Coptis chinensis root (GS-40), Mahonia aquifolium leaf (GS-41), Mahonia aquifolium root (GS-42), and Berberis vulgaris root (GS-43)) were positioned outside of the 95% confidence interval and closely aligned with the previously identified outlier samples. GS-07 correlated with Berberis vulgaris root and herb standards, GS-20 correlated with Mahonia aquifolium root and herb standards, and GS-33 clustered with Coptis chinensis root and rhizome standards. The abbreviation “RM” represents “reference material” which are the standards that have been vouchered or purchased by Chromadex.