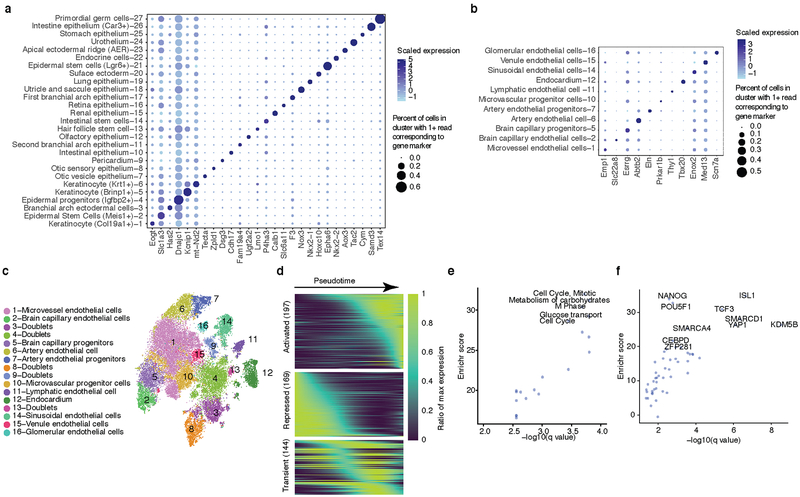
Extended Data Fig. 6. Analysis of mouse epithelium, endothelium and limb apical ectodermal ridge cells.
(a-b) Dot plot showing expression of one selected marker gene per epithelial (a) or endothelial (b) subtype. Doublet-derived subclusters (2/29 epithelial subtypes and 5/16 endothelial subtypes) are excluded from these plots, but are still shown in Fig. 3a and panel c, respectively. The size of the dot encodes the percentage of cells within a cell type, and its color encodes the average expression level. (c) t-SNE visualization and marker-based annotation of endothelial cell subtypes (n = 35,878). (d) Heatmap showing smoothed pseudotime-dependent differential gene expression (169 genes at FDR of 1%) in AER cells, generated by a spline fitting with generalized linear model (assuming gene expression following the negative binomial distribution) and scaled as a percent of maximum gene expression. Each row indicates a different gene, and these are split into subsets that are activated (top), repressed (middle) or exhibit transient dynamics (bottom) between E9.5 and E13.5. (e-f) Plots showing the −log10 transformed q value and Enrichr based combined score of enriched Reactome terms (e) and transcription factors (f) for genes whose expression significantly decreases in AER development. The top enriched pathway terms (Reactome2016) for significantly decreasing genes include cell cycle progression (Mitotic Cell Cycle, qval = 0.0002, one-sided Fisher exact test with multiple comparisons adjusted) and glucose metabolism (Metabolism of carbohydrates, qval = 0.0002, one-sided Fisher exact test with multiple comparisons adjusted). The top enriched TFs with targets from decreasing genes include pluripotent factors such as Isl1 (qval < 1e-5), Pou5f1 (qval = 0.002, one-sided Fisher exact test with multiple comparisons adjusted) and Nanog (qval = 0.003, one-sided Fisher exact test with multiple comparisons adjusted).

