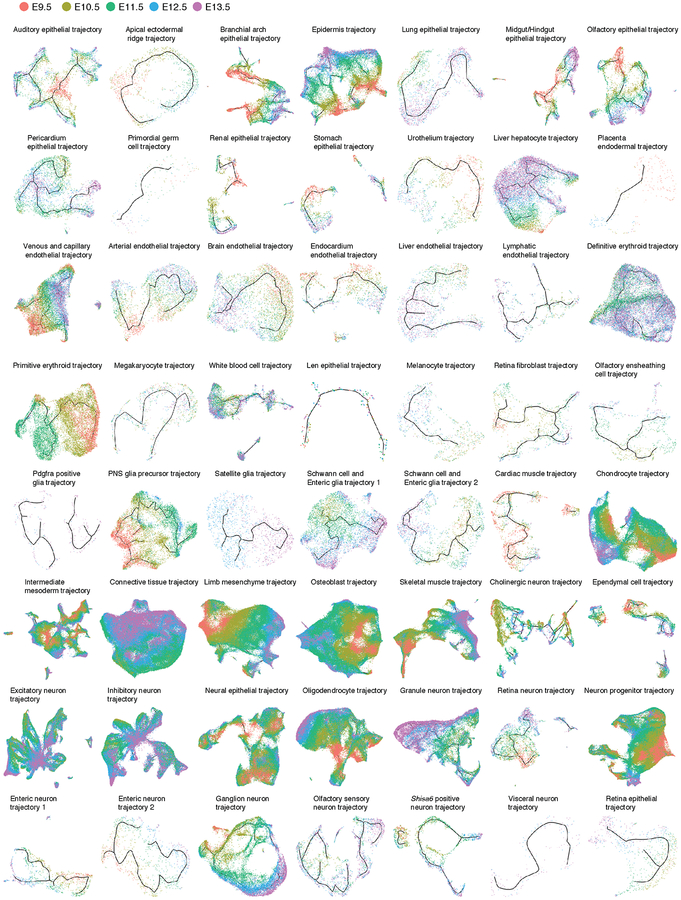
Extended Data Fig. 10. UMAP visualization of the 56 subtrajectories, colored by development stage.
We further iteratively reanalyzed and visualized with UMAP each of the 56 subtrajectories. Although Monocle 3 did not have access to these labels, the subtrajectories are highly consistent with developmental time (i.e. cells ordered from E9.5 to E13.5). The lines correspond to the principal graph learned by Monocle 3.

