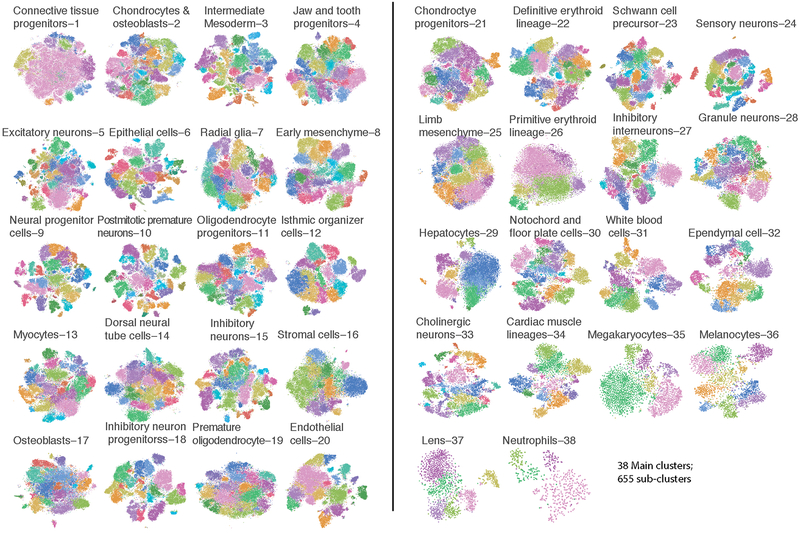
Extended Data Fig. 3. Louvain clustering and t-SNE visualization of subclusters of the each of 38 major cell types.
As cell type heterogeneity was readily apparent within many of the 38 clusters shown in Fig. 2a, we adopted an iterative strategy, repeating Louvain clustering on each main cell type to identify subclusters. After subclusters dominated by one or two embryos were removed and highly similar subclusters merged, a total of 655 subclusters (also termed ‘subtypes’ to distinguish them from the 38 major cell types identified by the initial clustering). Cell number n for each cell type is listed in Supplementary Table 3.

