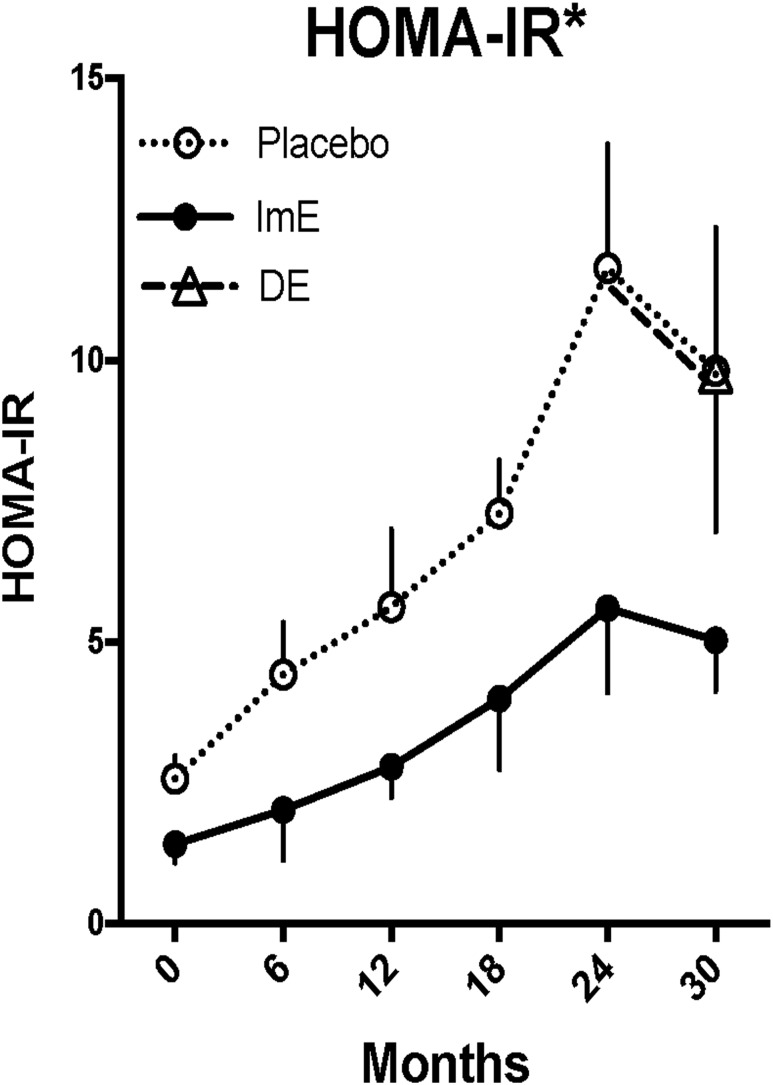
Figure 5.
Changes in HOMA-IR. HOMA-IR increased with time in all animals, but the rate of increase was slowed by ImE treatment. DE reduced HOMA-IR toward that of the ImE-treated group, although the decline at 30 months in both the ImE and DE groups could be caused by loss of animals with higher values, which is suggested by the large variance from 12 to 24 months in the ImE group. Data are mean ± SEM. *Groups are different by two-way ANOVA. At the 24-month time point, the placebo group is different from the ImE group by Sidak post hoc pairwise comparison.

