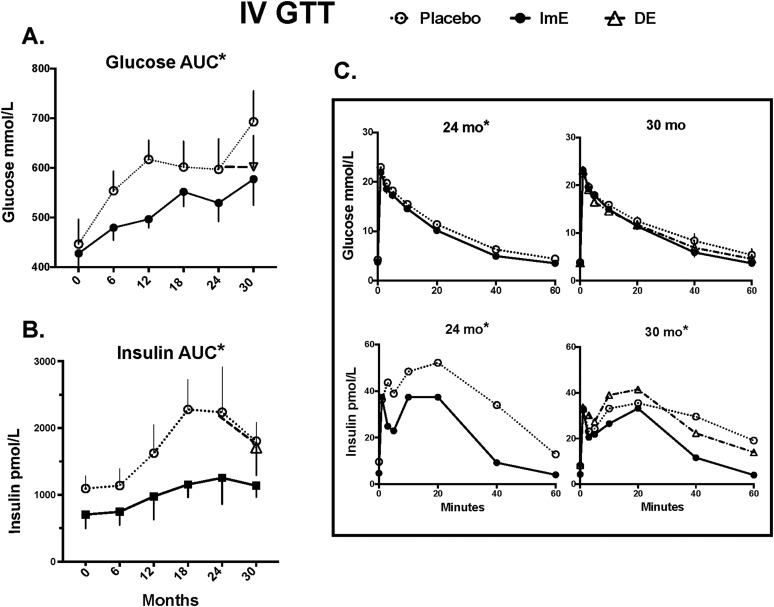
Figure 6.
Glucose and insulin AUCs during IVGTT from baseline through 30 months and glucose and insulin excursions during IVGTT at 24 and 30 months. (A) Glucose: AUC glucose values are significantly lower in the ImE-treated group than the placebo-treated group at all time points after treatment initiation. There was a significant increase in glucose AUC with time in both ImE- and placebo-treated groups. Between 24 and 30 months, DE appeared to reduce AUC glucose to the level observed in the ImE group, but there was no significant difference between the three groups due to variance and number of animals remaining. (B) Insulin: AUC insulin values were significantly lower in the ImE-treated group than the placebo group at all time points after treatment initiation. There were also significant increases in AUC insulin with time. DE had no effect on insulin AUC. (C) Glucose clearance curves (upper graphs) are nearly identical between 24 and 30 months in all three groups, but first- and second-phase insulin levels (lower graphs) decrease in the placebo group at 30 months compared with 24 months, show a slightly improved (increased) curve in the DE group, and remain unchanged in the ImE group. Data are mean ± SEM. *Groups are different by two-way ANOVA.

