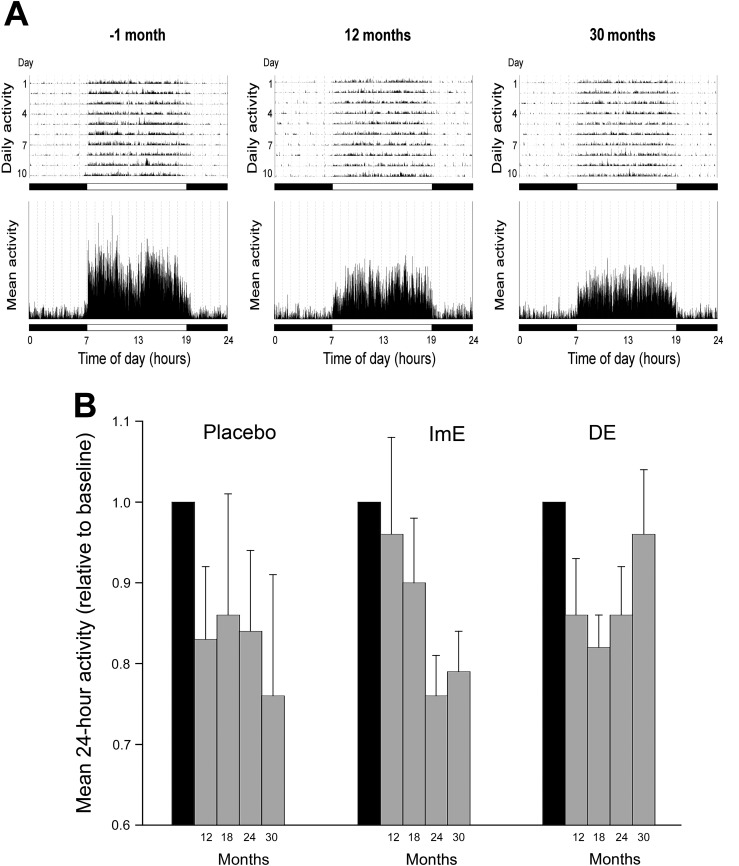
Figure 9.
Activity levels. (A) Representative actograms from a female rhesus macaque obtained over ~10 days, at −1 month and subsequently after 12 and 30 months of exposure to a WSD. In the upper panels, the height of the vertical lines indicates the intensity of physical activity at a particular time of day; the mean 24-hour activity profiles across the 10 consecutive days are depicted in the lower panels. The horizontal black and white bars correspond to the times of night and day, respectively. (B) The average 24-hour daily activity of each treatment group at various time points after exposure to a WSD. Each bar represents the mean activity level (±SEM) normalized against the mean baseline activity level (shown as a gray bar) but includes only animals that survived until 30 months. Although two-way repeated-measures ANOVA showed no significant difference between the treatment groups, there appeared to be a temporary maintenance of elevated activity after estradiol supplementation, seen at months 12 and 30 in the ImE and DE groups, respectively.

