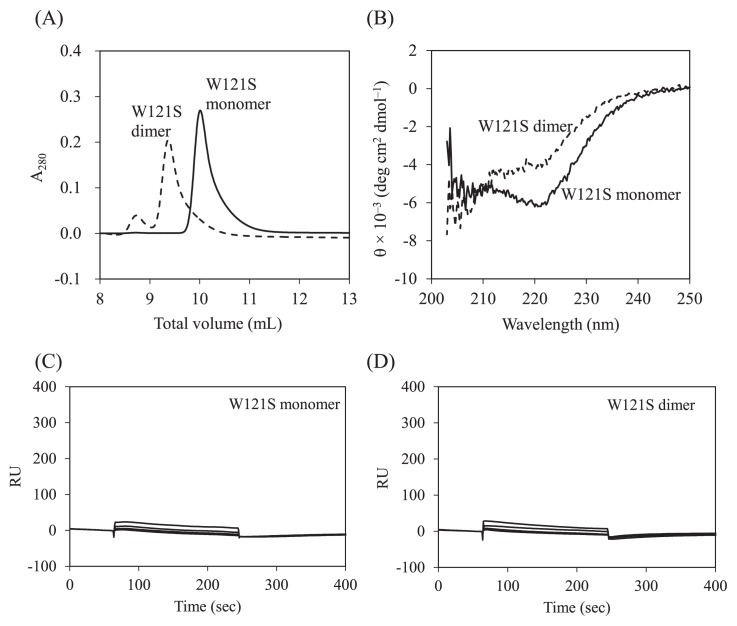
Figure 5.
SEC, CD, and SPR analysis of Grb2 SH2 mutant, W121S. (A) Elution profiles of the monomer (solid line) and the dimer (broken line). (B) Far-UV CD spectra of the monomer (solid line) and the dimer (broken line). (C) Typical sensorgrams for binding of the monomer (800, 1600, 3200, and 6400 nM) to immobilized CD28. (D) Typical sensorgrams for binding of the dimer (800, 1600, 3200, and 6400 nM) to immobilized CD28.

