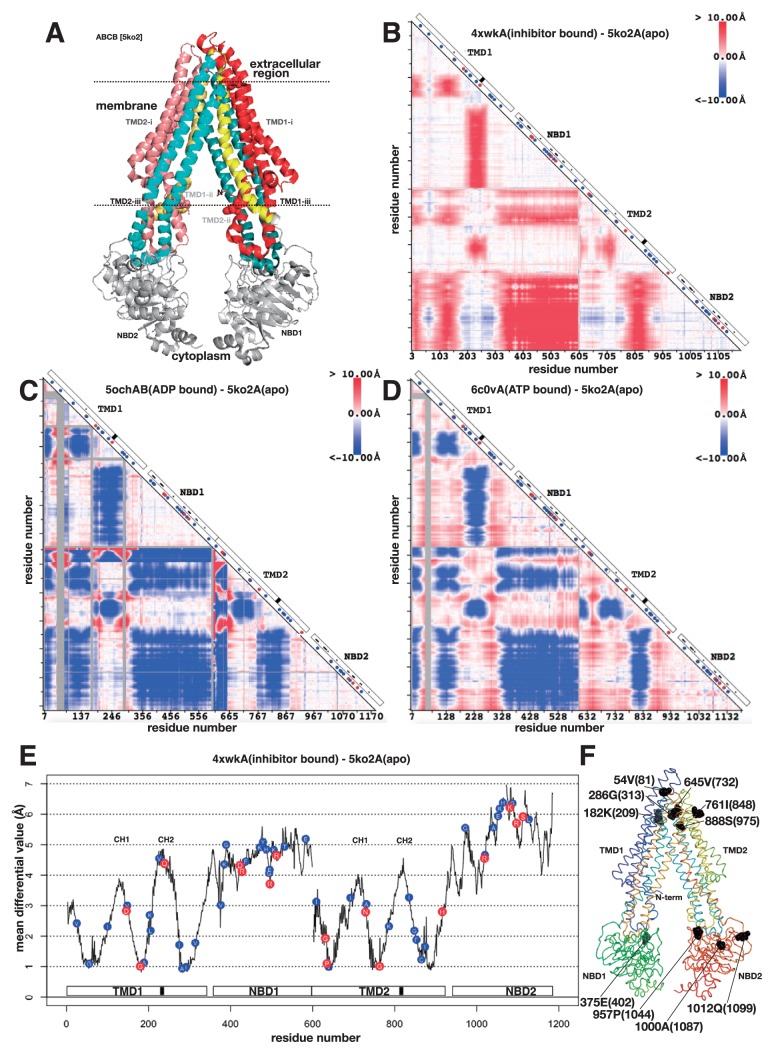
Figure 2.
3D structure, differential map and differential plot of sub-family B of ABC transporters. A. 3D structure of mouse P-glycoprotein (ABCB4) (PDB ID: 5ko2). See text for the colouring of the protein. Dotted lines are the putative surfaces of the membrane. Seven residues are in space-filling model. They are the locations of certain pathogenic variations. B. Differential map between mouse P-glycoprotein with an inhibitor (PDB ID: 4xwk) and apo form of mouse P-glycoprotein (PDB ID: 5ko2). The horizontal axis from left to right and the vertical axis from top to bottom are the residue number of P-glycoprotein. The difference of the distances between residues i and j (measured between Cα atoms) in two 3D structures of P-glycoproteins is colour-coded at the intersection in the triangular map. Red colour means that the distance of the pair of residues became longer, and blue colour means shorter. On the diagonal axis, a white box indicates domain organization, a black box indicates a location of the second coupling helix (see text), a small dot in the white box indicates ATP-binding residue, a blue circle indicates a location of benign variation, a red circle indicates a location of pathogenic variation, and a white circle indicates a location of conflicting variation. C. The same as B, the differential map between human ABCB8 with ADP molecule (PDB ID: 5ocha) and mouse P-glycoprotein (PDB ID: 5ko2). Grey colour in the triangle indicates an insertion region in human ABCB8 compared with mouse P-glycoprotein. D. The differential map between human P-glycoprotein in ATP-binding outward-facing conformation (PDB ID: 6c0v) and mouse P-glycoprotein (PDB ID: 5ko2). E. Differential plot based on B. Horizontal axis is the residue number and the vertical axis is the mean differential value (). A white box on the horizontal axis shows domain organization and a black box is the location of the second coupling helix. A blue circle with amino acid one letter code on the plot is the position of benign variation and red circle is the position of pathogenic variation. Those variations were derived from the ones on ABCB genes. CH1 and CH2 indicate the locations of the first and the second coupling helices, respectively, defined in refs. 24 and 25. F. Ribbon model of mouse P-glycoprotein protein, the flip side of A. The chain trace is shown in rainbow colour. Ten residues in space-filling model are located in the local minima of the differential plot in E. The residue is identified by the sequential number (equal to the horizontal axis of E), amino acid one letter code and the residue number (the number from the N-terminus of the contiguous sequence).

