
Figure 2:
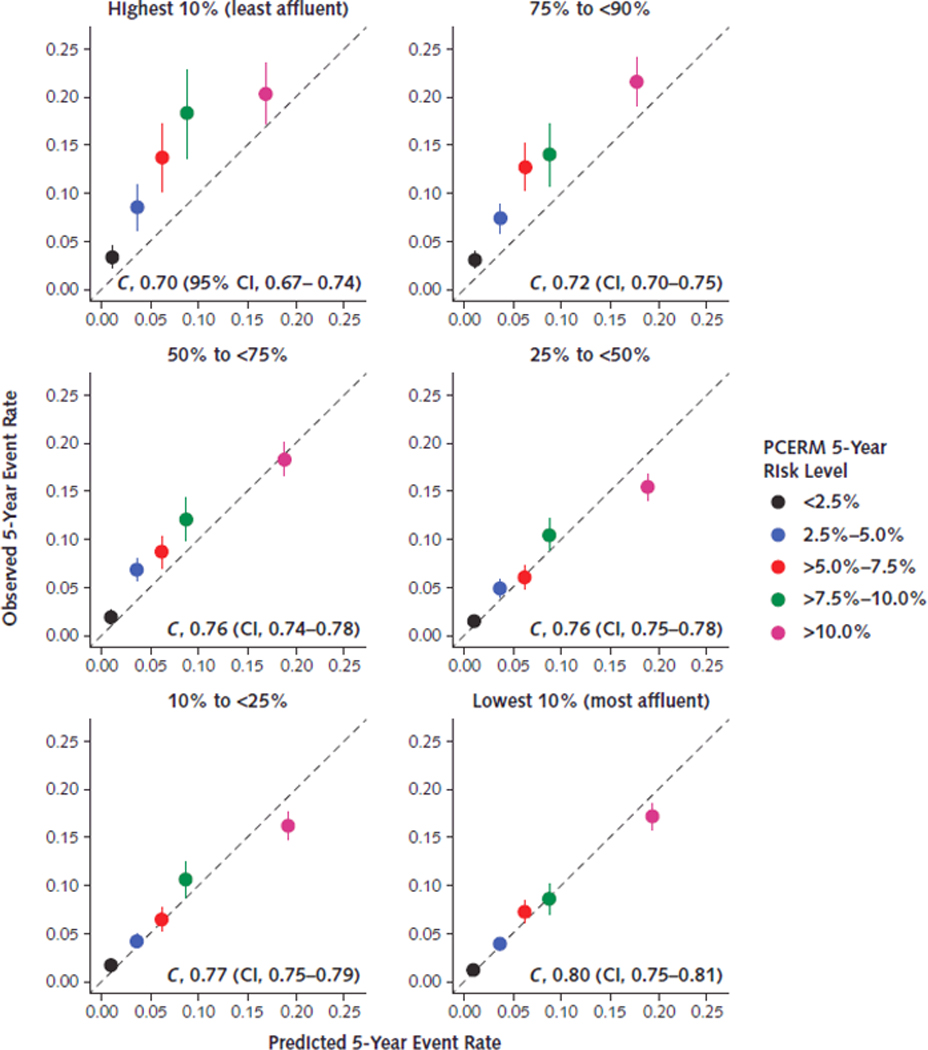
Prognostic accuracy of the PCERM across strata defined according to percentile groups of the neighborhood disadvantage index (highest percentiles correspond to the least affluent communities). Perfect calibration of the PCERM is represented along the line y = x; points above this line indicate under-estimation of risk by the PCERM in relation to observed event rates, and points below this line indicate over-estimation of risk. Concordance indices (C) and corresponding 95% confidence intervals are displayed within each panel. The concordance index ranges from 0.5 to 1.0, where a value of 0.5 represents no discrimination of events from non-events and a value of 1.0 represents complete separation of outcomes. NDI = neighborhood disadvantage index; PCERM = Pooled Cohort Equations Risk Model.