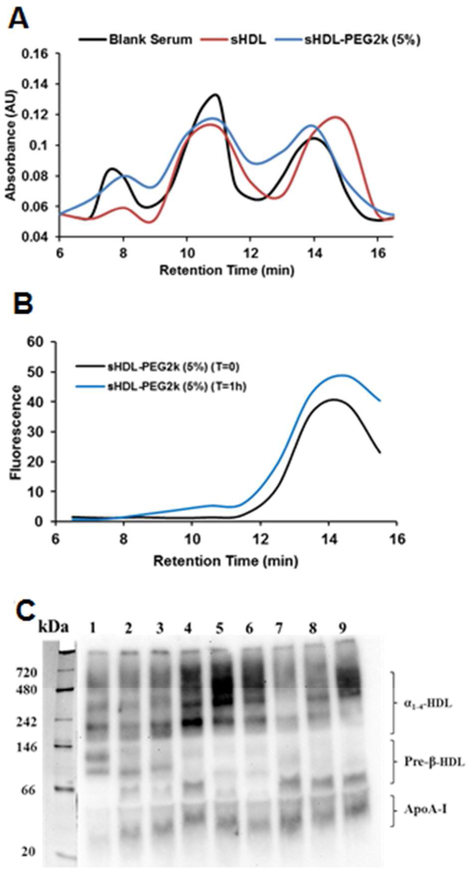
Figure 4.
The cholesterol distribution between VLDL, LDL and HDL lipoprotein fractions before and at 1 hour after incubation of sHDL and FITC labelled sHDL-PEG2k (5%) with human serum at 37 °C (Panel A). The distribution of FITC-labelled PEG2k component in sHDL-PEG2k (5%) among lipoproteins after incubation was shown in Panel B. The ApoA-I distribution between various subclasses of HDL after 1 hr incubation was determined by 1-D native page electrophoresis and visualized by western blot using anti-apoA-I antibody (Panel C). Lane 1 was the control serum, lane 2, 3, 4, 5 ,6 represented free 22A, sHDL, sHDL-PEG 2k (5%), sHDL-PEG2k (10%), sHDL-PEG5k (5%) at peptide concentration of 0.3 mg/ml. Lane 7, 8, 9 represented sHDL, sHDL-PEG 2k (5%), sHDL-PEG2k (10%) at peptide concentration of 1.0 mg/ml.

