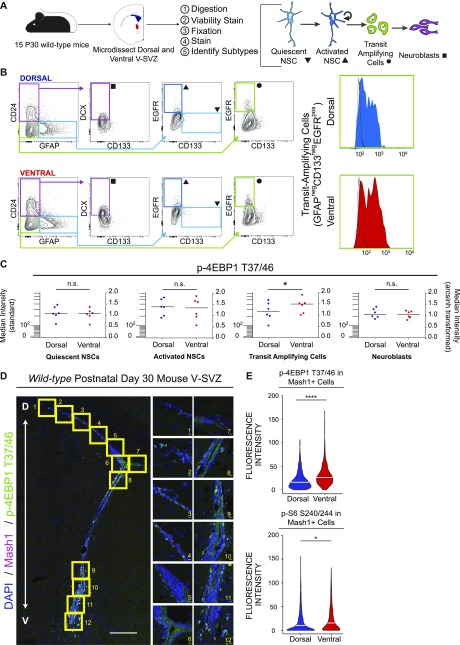
Figure 3. The TAP population exhibits the highest mTORC1 signaling differences between dorsal and ventral regions.
(A) Cartoon schematic outlining prospective isolation from dissection to cell identification. (B, C) Biaxial gating strategy to obtain V-SVZ cell types. Symbols at terminal gates correspond to cell types in (C). To the right are representative histograms showing intensity of p-4EBP1 T37/46 signal in freshly isolated dorsal (blue) and ventral (red) TAPs. Black histogram outline shows the fluorescence minus one control for each sample. (C) Graphs show median fluorescence intensity data for p-4EBP1 T37/46 from 7 sets of 15 pooled mice each (105 total mice); left: standard scale and right: arcsinh-transformed. p-4EBP1 T37/46 is elevated in ventral TAPs relative to dorsal (P = 0.0175, paired t test, bar = median) but is not different in the other cell types shown (qNSCs [P = 0.1931], aNSCs [P = 0.5853], and neuroblasts [P = 0.1374]). (D) Representative tilescan confocal images of V-SVZ stained for DAPI (blue), Mash1 (red), and p-4EBP1 T37/46 (green), with boxed areas highlighted to the right. Scale bars: 100 μm (tilescan), 10 μm (63× images). (E) Quantification of per-cell intensity for p-4EBP1 T37/46 (top: 1,026 dorsal and 590 ventral cells total) and p-S6 S240/244 (bottom: 1,306 dorsal and 805 ventral cells) in confocal images. Both phosphorylation events are elevated in ventral Mash1+ cells relative to dorsal (P < 0.0001 [p-4EBP1] and P = 0.0161 [p-S6 S240/244], Wilcoxon signed rank tests). Each experiment: n = 4 mice, 3 sections/mouse. For all graphs, bars represent mean ± SD.

