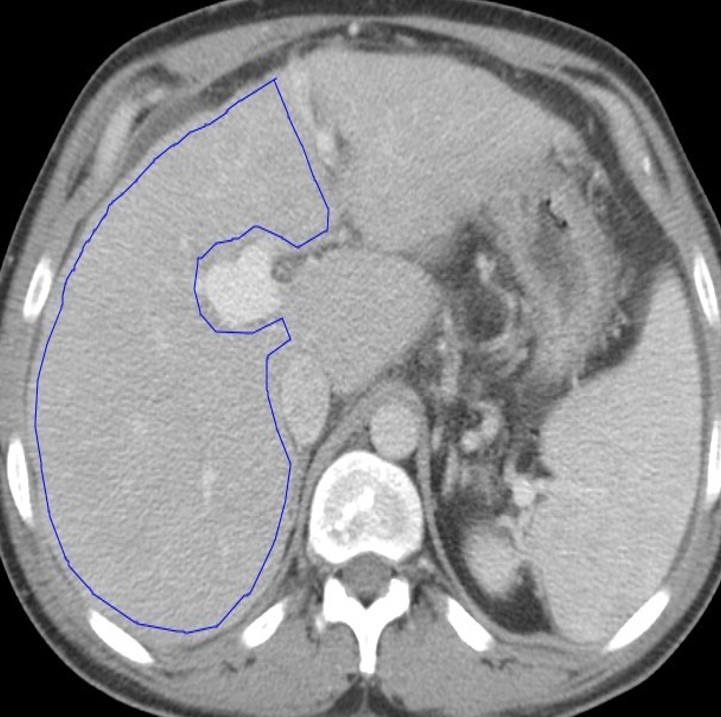
Figure 2.

CT texture analysis measurements: A single slice ROI was drawn around the total liver, segments I–III (not shown), and segments IV–VIII (A). The analysis was performed on data from segments IV–VIII based on prior work. Texture maps were generated, where pink and red dots represent positive pixels and blue and purple dots represent negative pixel. The software used has a filtration step that allows features to be grouped into fine (B), medium (C), and coarse (D) sizes based on spatial scaling factors. A pixel histogram is also generated for the ROI and analyzed. ROI, region of interest.
