
Figure 3.
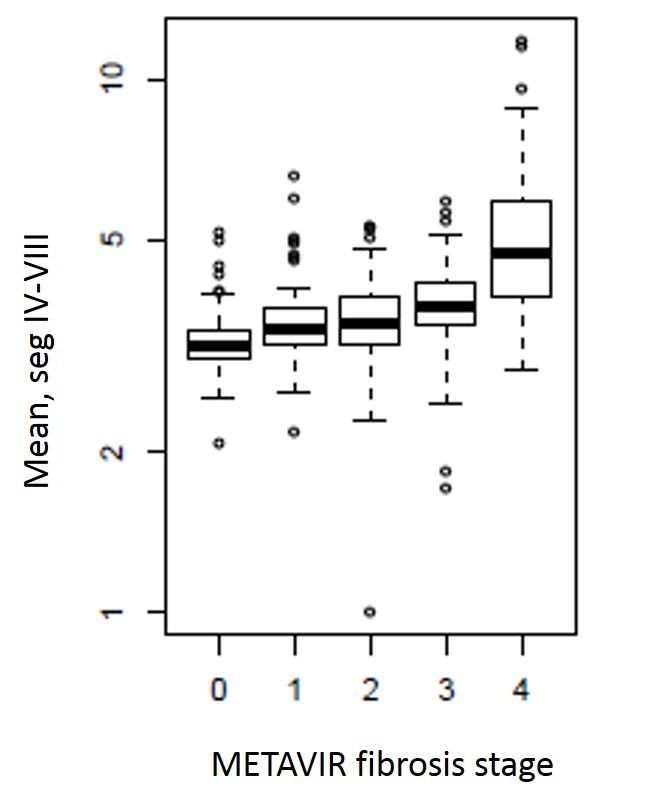
Box and whisker plot showing mean gray level intensity values on the y-axis and METAVIR fibrosis stage on the x-axis. Measurements were obtained in the portal venous phase in segments IV–VIII, and values of mean gray level intensity increase with increasing stage of fibrosis. This relationship was seen across all spatial scaling factors, but was strongest for medium-sized features (ssf 3, shown here).