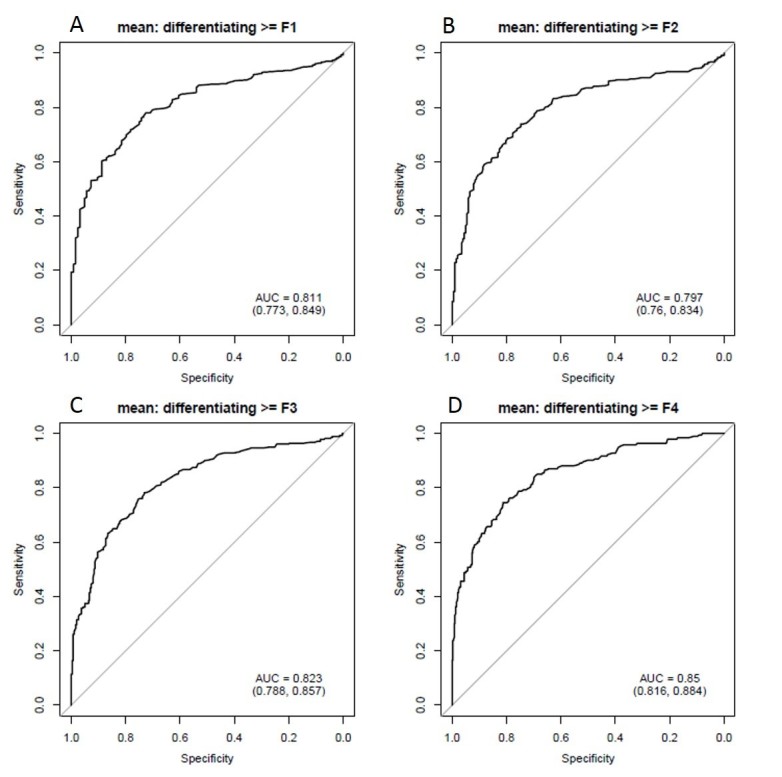
Figure 4.

Diagnostic performance of mean gray level intensity for identifying hepatic fibrosis on portal venous phase images in segments IV–VIII. ROC AUC plots for mean gray level intensity in predicting hepatic fibrosis. Top left panel (A) demonstrates detection of any fibrosis (AUC 0.81), top right (B) shows significant fibrosis (≥F2, AUC 0.8), lower left (C) shows advanced fibrosis (≥F3, AUC 0.82) and bottom right (D) shows cirrhosis (0.85). AUC, area under the curve; ROC, receiver operatingcharacteristic.
