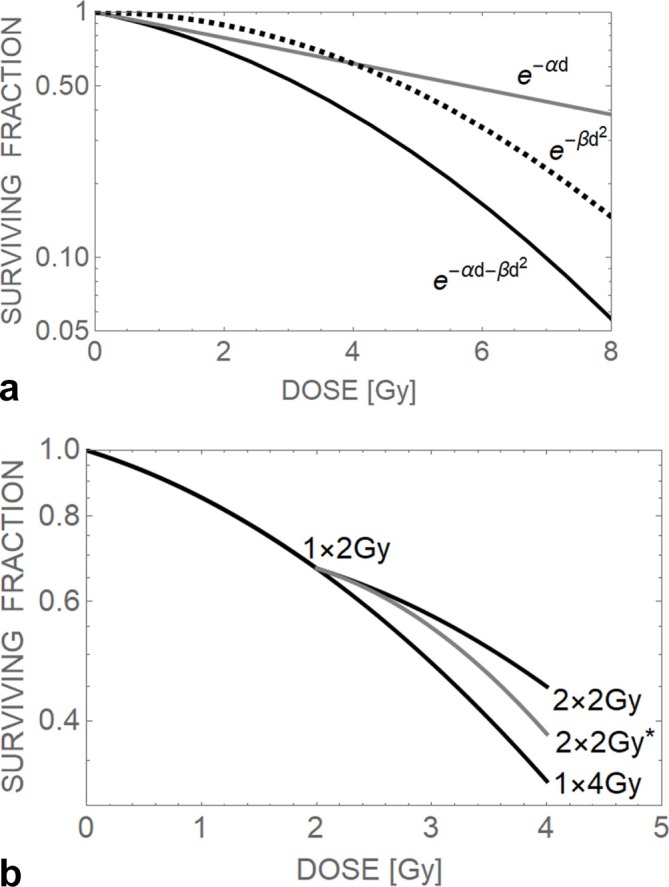
Figure 1.

Theoretical cell survival curves, (a) showing the linearity of the exponential -αd relationship and the curvature provided by the -βd2 relationship, and their summation as -αd-βd2, which shows only initial linearity followed by increasing curvature, (b) the survival curves for a single dose of 2 Gy, 4 Gy and a ‘split’ dose of 2 × 2 Gy after an interval of time that has allowed near complete repair of sub-lethal damage. An example of incomplete repair is shown by the grey 2 × 2 Gy* plot where the second dose of 2 Gy has been delivered after a shorter interval of time that allows substantial amounts of incompletely repaired damage to form more lethal events during the second 2 Gy fraction, resulting in a higher survival fraction than in the other 2 × 2 Gy case.
