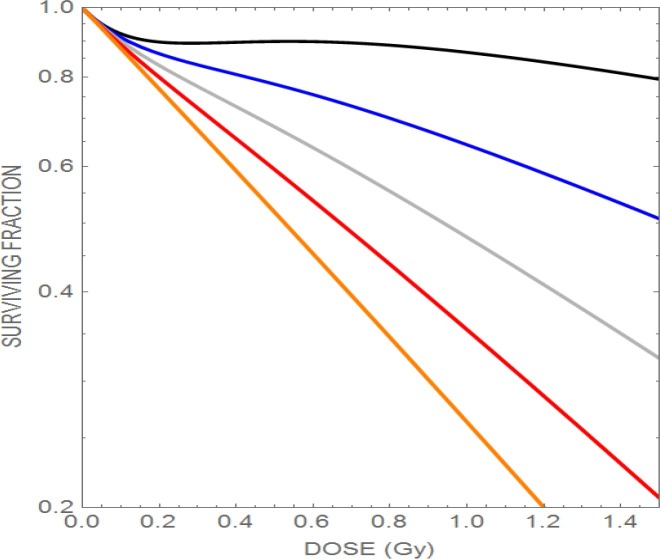
Figure 3.
Plot of the effect of increasing the radiosensitivity (assumed here due to the LET-RBE effect) causing progressive loss of low dose hyper-radiosensitivity. The upper curve has α=0.1 Gy− 1, followed downwards by α=0.4 Gy− 1, α=0.7 Gy− 1, and α=1.0 Gy− 1. The lowest line represents the maximum possible radiosensitivity for the cell line (1.3 Gy− 1). (reproduced with permission from Jones).

