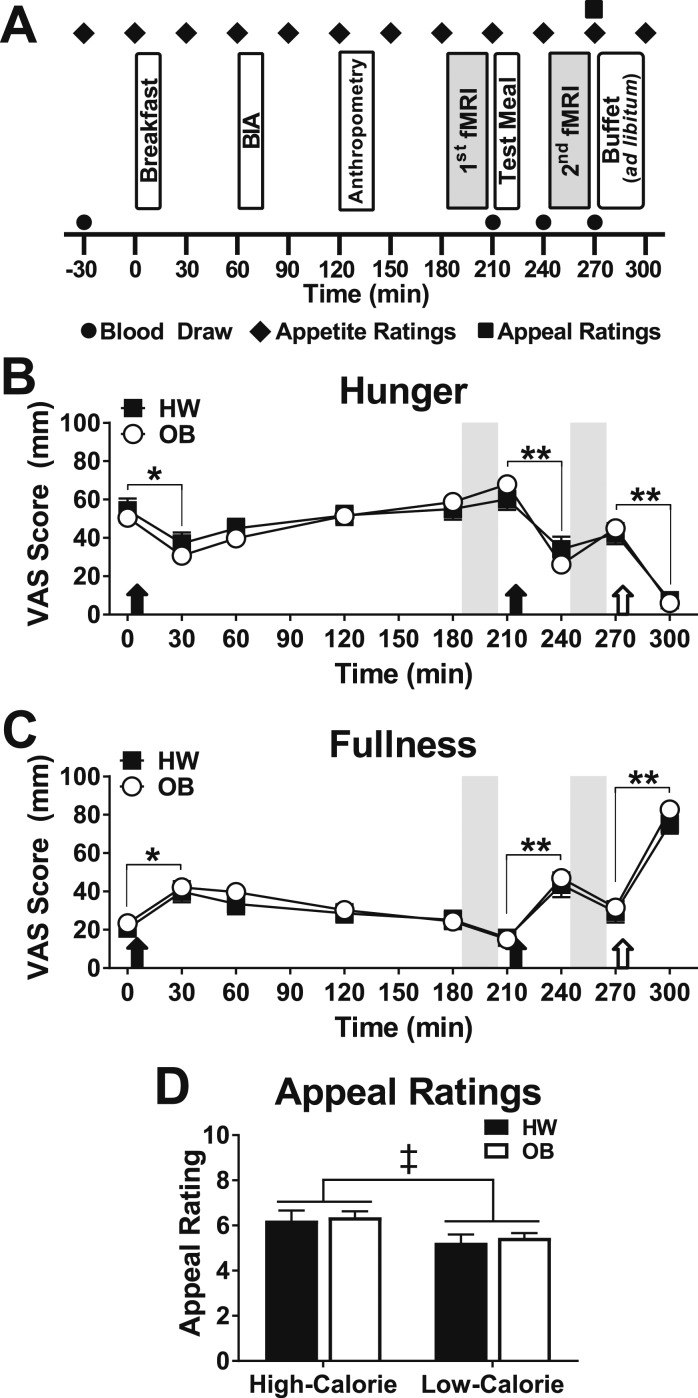
Figure 1.
Timing of study procedures and appetite and appeal ratings in children of HW and children with OB. (A) Participants arrived fasting and underwent four blood draws [fasting (t−30), prior to the test meal (t210), then 30 (t240) and 60 (t270) min after the meal]. The first MRI scan session occurred 3 h after the standardized breakfast and was immediately followed by a standardized test meal, consumed within 10 min. The second MRI scan session began 30 min after the start of the test meal. The breakfast and test meal were titrated to represent 10% and 33%, respectively, of each participant’s estimated daily caloric intake whereas the buffet meal was ad libitum. Bioelectrical impedance analysis (BIA) was used to measure body composition. Appetite ratings were performed serially using visual analog scales (VAS) for hunger and fullness, whereas appeal ratings were obtained once, immediately prior to the buffet meal. (B and C) Appetite ratings of hunger (B) and fullness (C) were not different between groups [hunger, χ2(1) = 0.06, P = 0.80; fullness, χ2(1) = 0.53, P = 0.47]. All meals (filled arrows mark standardized meals; open arrows indicate ad libitum buffet meal) significantly suppressed hunger and increased fullness. (D) Participants rated high-calorie images as more appealing [χ2(1) = 9.99, P < 0.01]. Data are means ± SEM. P values for appetite and appeal ratings were determined by linear mixed models (unadjusted). Gray bars indicate fMRI sessions. n = 22 children of a HW, 54 children with OB (n = 2 missing for appeal ratings in the OB group). *P < 0.01, **P < 0.0001, premeal vs postmeal appetite ratings for both groups; ‡P < 0.01, vs low-calorie images.

