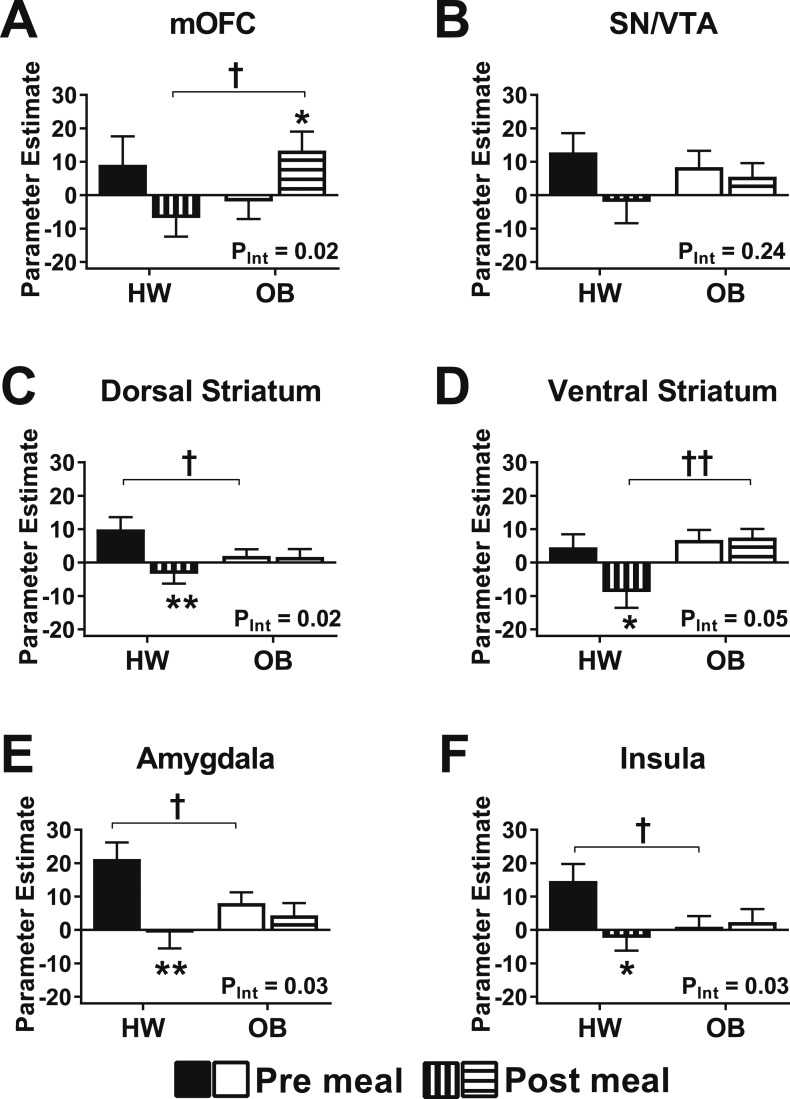
Figure 3.
Effect of a meal on regional activation. (A–F) Mean parameter estimates in regions considered separately in children of HW and children with OB were measured before (filled/open bars) and after (striped bars) a standardized test meal for high-calorie foods vs objects. (A) mOFC, (B) SN/VTA, (C) DS, (D) VS, (E) amygdala, (F) insula. Data are means ± SEM. P values were determined by linear mixed models. *P < 0.05 vs **P < 0.01, vs premeal within same group; †P < 0.05, ††P < 0.01, HW group vs OB group.

