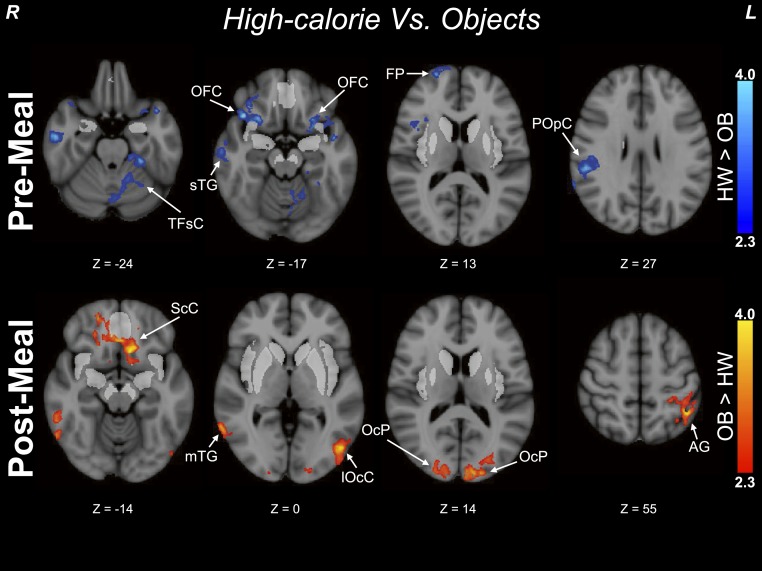
Figure 5.
Exploratory voxelwise analyses outside of a priori regions. The top panel shows clusters of greater activation in children of HW vs children with OB prior to the standardized meal. The bottom panel shows clusters with greater activation in children of HW vs children with OB after consumption of a standardized meal. Analyses excluded previously tested a priori ROIs, and all clusters depict activation by high-calorie foods vs objects. Z statistic maps were corrected for multiple comparisons and were thresholded at Z > 1.65 and a cluster significance threshold of P = 0.05 (FWE corrected). Premeal, n = 22 children of HW, n = 51 children with OB; postmeal, n = 21 children of HW, N = 46 children with OB. Color scales provide Z values of functional activation. Montreal Neurologic Institute coordinates are indicated. A priori ROIs are depicted in bright gray. Peak Montreal Neurologic Institute coordinates are provided in Table 4. AG, angular gyrus; FP, frontal pole; lOcC, lateral occipital cortex; mTG, middle temporal gyrus; OcP, occipital pole; POpC, parietal operculum cortex; ScC, subcallosal cortex; sTG, superior temporal gyrus; TFsC, temporal fusiform cortex.

