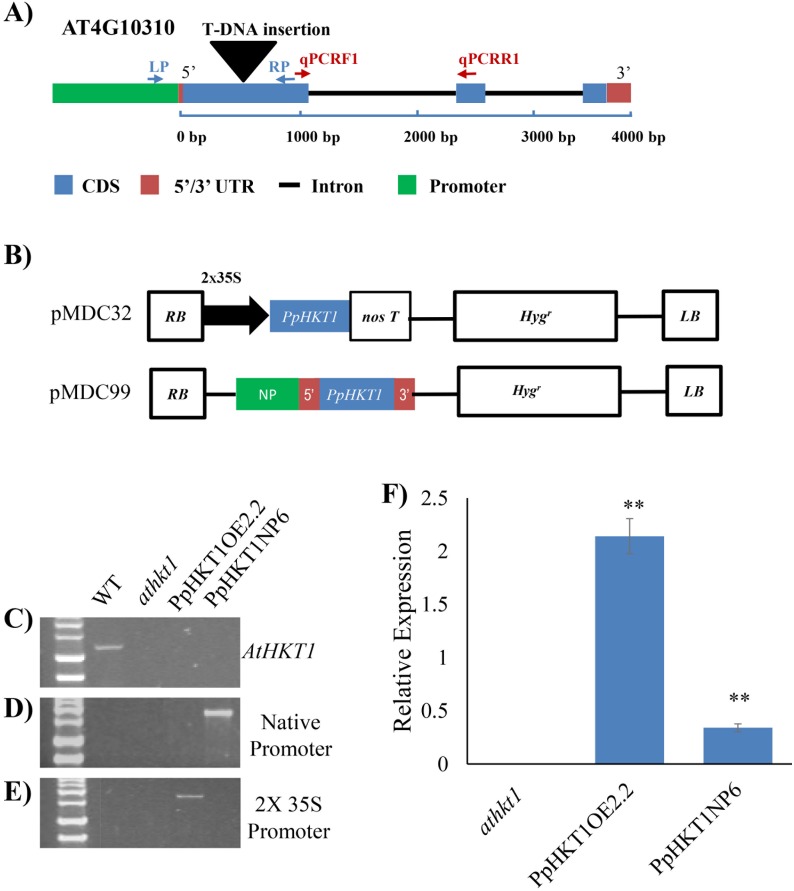
Fig 1. Screening of transgenic lines.
A) Gene structure of athkt1 with T-DNA insertion and location of primers for genotyping and qRT-PCR. B) Gene structure of overexpression construct in gateway vector pMDC32 and expression under native promoter in promoter-less gateway vector pMDC99. C) Screening of WT, athkt1 mutant and the transgenic lines by amplification with GABI_795G10_LP/GABI_795G10_RP set of primers specific to the AtHKT1 gene. WT had amplification of 1.2 Kb band and no amplification was seen in the athkt1 mutant or the transgenic lines. D) Screening of Arabidopsis lines expressing PpHKT1 under native promoter. The gDNA was amplified with PpHKT1_Start_F and PpHKT1_3’UTR_R set of primers. Only transgenic line harboring pMDC99 carrying native promoter construct amplified the 1.8 Kb amplicon. E) Screening of overexpressor line by amplification with 35SProm_F and PpHKT1_Stop_R set of primers. Only Arabidopsis line harboring pMDC32 carrying CDS construct amplified 1.7 Kb amplicon. F) Relative expression of PpHKT1 in mutant and transgenic lines. The HKT1OE2.2 lines (overexpressor) showed ~15- fold change in expression while HKT1NP6 line (endogenous) showed ~2.5- fold change in expression with respect to the athkt1 mutant. ANOVA single factor was used to depict the statistical differences between the athkt1 mutant and each of the transgenic lines. P≤0.001 (**).

