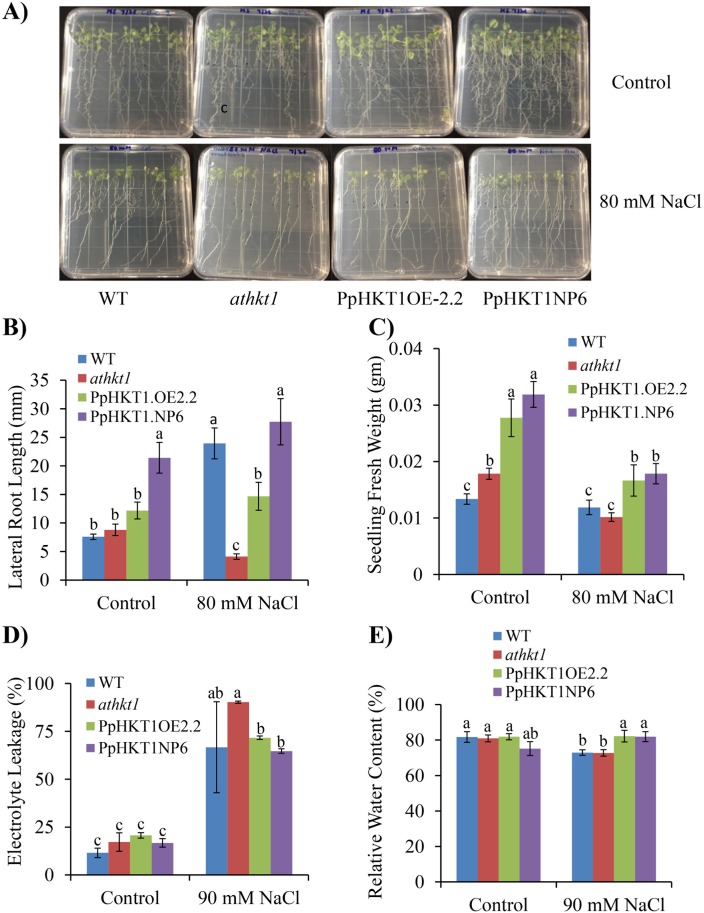
Fig 3. Different salinity stress tolerance parameters evaluated in WT, athkt1 and the transgenic lines.
A) Lateral root growth assay. Arabidopsis lines were exposed to 80 mM NaCl and pictured 10 days after treatment. B) Average lateral root length calculated by Image J software. C) Seedling average fresh weight after 10 days under control or 80 mM NaCl, with 10 seedlings per replicate (n = 3). D) Electrolyte leakage calculated 15 days after 90 mM NaCl treatment. E) Relative water content calculated 7 days after 90 mM NaCl treatment. ANOVA single factor was used to depict the statistical differences between athkt1 mutant and each of the transgenic lines. Genotypic means followed by the same letters are not significantly different according to LSD (0.05).

