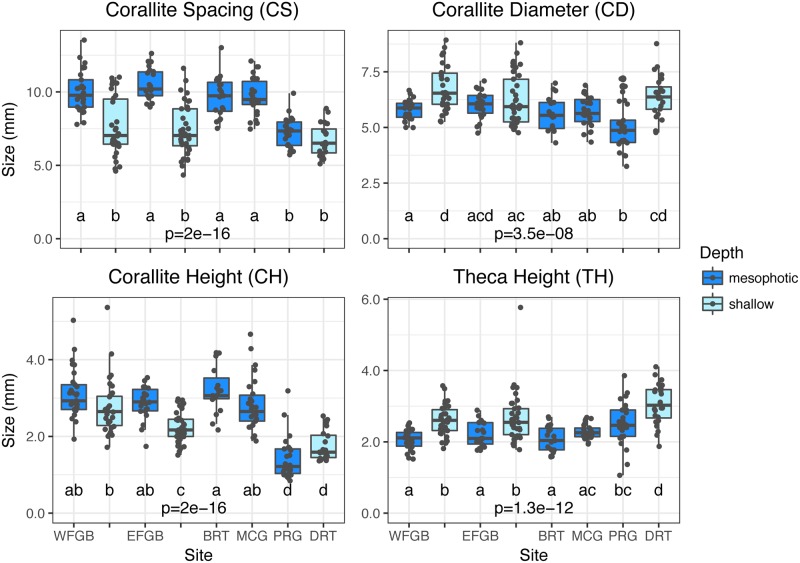
Fig 2. Corallite sample means.
Boxplots with sample overlays for corallite spacing (CS), corallite diameter (CD), corallite height (CH), and theca height (TH) across six sites and two depth zones in the Gulf of Mexico. Overall p values represent Kruskal-Wallis tests across sites and depth zones for each metric and different letters denote significant differences (p<0.05) between pairwise comparisons of sites and depth zones generated by Dunn’s tests.

