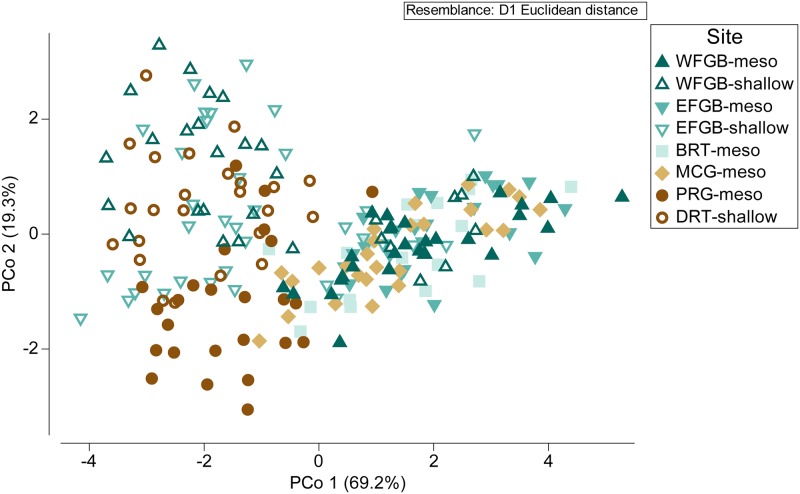
Fig 3. Principal coordinates analysis.
Principal coordinates analysis (PCoA) ordination of corallite morphology across six sites in the Gulf of Mexico, explaining 88.5% of the total variation (PCo 1: 69.2%, PCo 2: 19.3%). Degree of difference among samples represented by Euclidean distance between sample points. Color and shape of each point corresponds to site and depth zone.

